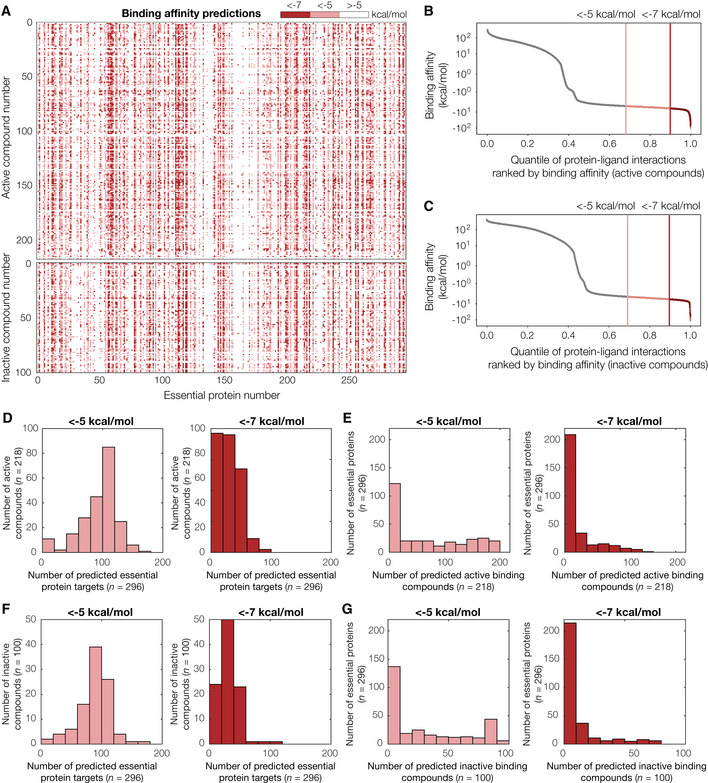
Figure 2. Binding affinity predictions for 218 active compounds, 100 inactive compounds, and 296 AlphaFold2‐predicted Escherichia coli essential protein structures.

-
AInteraction matrix showing the predicted binding affinities (kcal/mol) between all pairs of active or inactive compounds and essential proteins modeled, discretized into bins of < −7 kcal/mol (strong predicted binding), < −5 kcal/mol (moderate predicted binding), and > −5 kcal/mol (no predicted binding). Predictions for active compounds are shown at top, and inactive compounds are shown at bottom.
-
B, CRank‐ordered binding affinities for the protein‐ligand pairs modeled by our approach. Vertical lines indicate binding affinity thresholds of −5 kcal/mol and −7 kcal/mol. Plots are for protein‐ligand interactions involving all 218 active compounds (B) or 100 inactive compounds (C).
-
DHistograms of numbers of predicted essential protein targets with binding affinity < −5 kcal/mol (left) or < −7 kcal/mol (right), for all 218 active compounds.
-
EHistograms of numbers of predicted binding compounds with binding affinity < −5 kcal/mol (left) or < −7 kcal/mol (right), for all 296 essential proteins.
-
F, GSimilar to (D–E), but for all 100 inactive compounds modeled.
