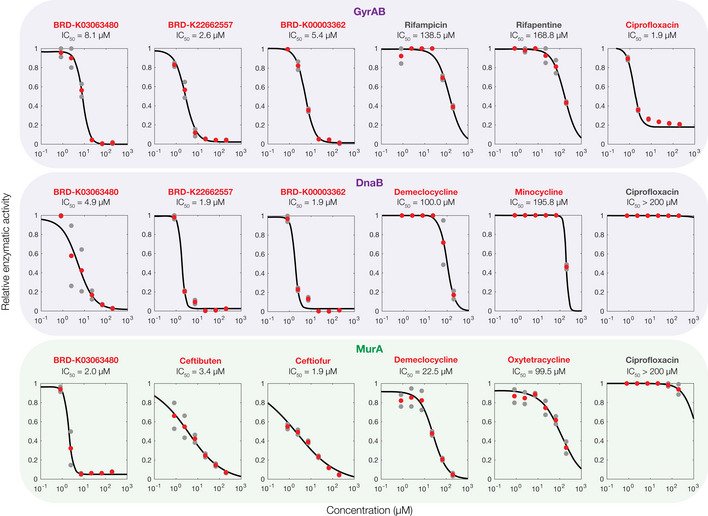
Figure EV2. Enzymatic inhibition screen validation experiments.

Dose–response experiments showing the relative enzymatic activity of three essential proteins, each treated with six antibacterial compounds. Relative activity is measured with respect to untreated controls. Data from two biological replicates (gray points) are shown, and mean activity values (red points) were fit to Hill functions (black curves) to estimate IC50 values. Compound names in red indicate hits from the screens shown in Fig 3 of the main text, and compound names in gray indicate non‐hits. Essential proteins correspond to the genes indicated and are involved in DNA replication (purple) and cell wall synthesis (green).
