-
A
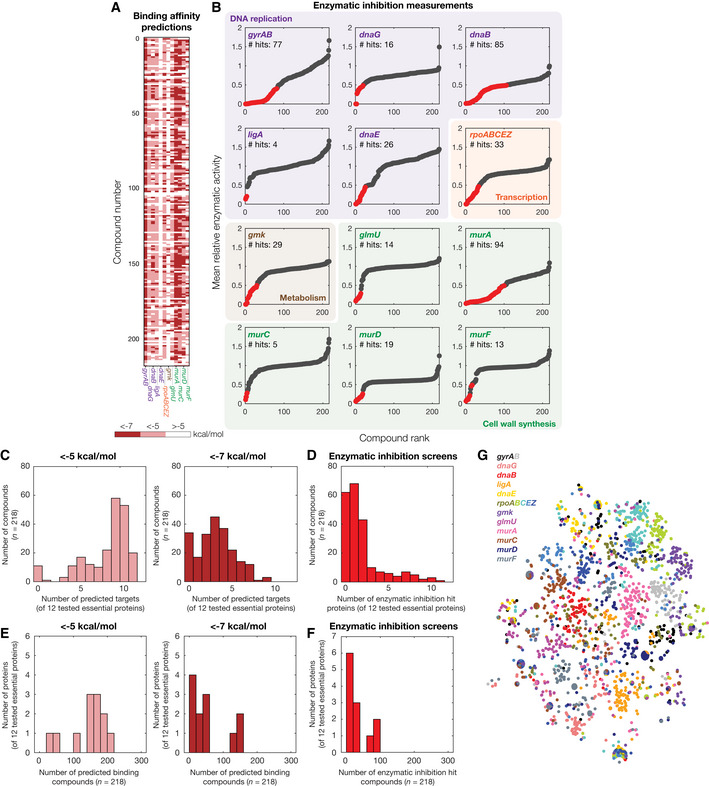
Interaction matrix showing the predicted binding affinities (kcal/mol) between all pairs of active compounds and 12 essential proteins tested for enzymatic inhibition, discretized into bins of < −7 kcal/mol, < −5 kcal/mol, and > −5 kcal/mol.
-
B
Rank‐ordered mean relative enzymatic activity across all 218 active compounds, at a final concentration of 100 μM, for each of 12 essential proteins experimentally tested for enzymatic inhibition. Essential proteins correspond to the genes indicated and are involved in DNA replication (purple), transcription (orange), metabolism (brown), and cell wall synthesis (green). Results show the mean of two biological replicates, and relative activity is measured with respect to untreated controls. Binding interaction hits are protein‐ligand interactions with relative enzymatic activities of < 50% in both replicates (red points). All other interactions are designated as non‐hits (gray points).
-
C
Histogram of numbers of predicted essential protein targets with binding affinity < −5 kcal/mol (left) or < −7 kcal/mol (right), for all 218 active compounds and all 12 essential proteins tested in (B).
-
D
Histogram of numbers of enzymatic inhibition hit proteins, for all 218 active compounds and all 12 essential proteins tested in (B).
-
E
Histogram of numbers of predicted binding compounds with binding affinity < −5 kcal/mol (left) or < −7 kcal/mol (right), for all 218 active compounds and all 12 essential proteins tested in (B).
-
F
Histogram of numbers of enzymatic inhibition hit compounds, for all 218 active compounds and all 12 essential proteins tested in (B).
-
G
t‐SNE plot of protein‐ligand interaction fingerprints, colored by protein and protein subunit.

