
Figure EV3. No correlation between model performance and AlphaFold2 prediction confidence.
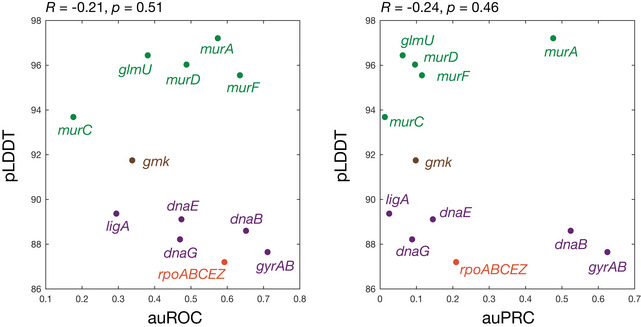
Shown is a plot of the auROC values from Fig 4D of the main text or auPRC values from Fig EV5 against AlphaFold2's per‐residue confidence score (pLDDT), averaged across each protein, for all 12 empirically tested essential proteins. Essential proteins correspond to the genes indicated and are involved in DNA replication (purple), transcription (orange), metabolism (brown), and cell wall synthesis (green). Higher pLDDT scores indicate higher model confidence. The Pearson correlation coefficients, R, and corresponding P‐values are indicated.