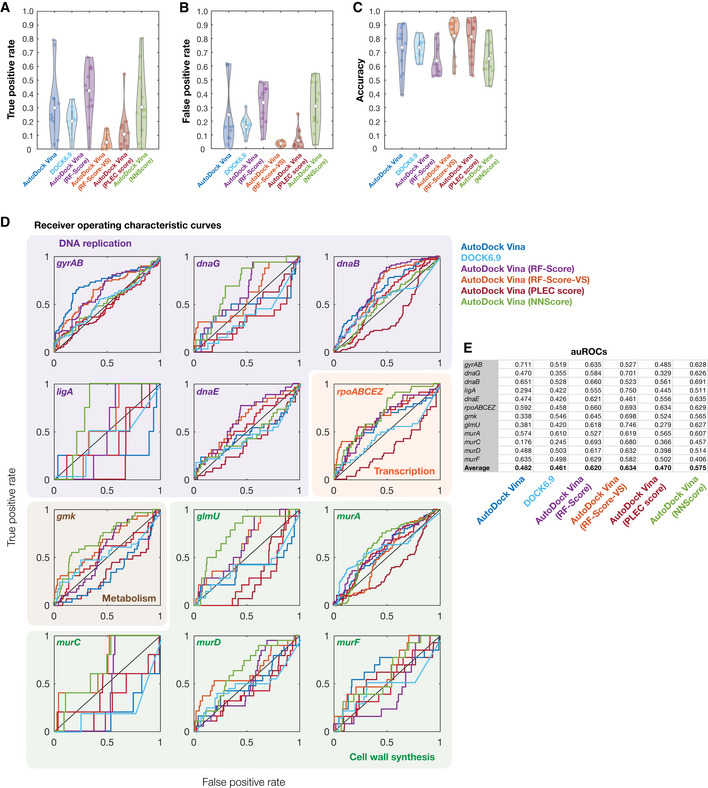
Figure EV4. Model performance for different rescoring functions.

-
A–CDistributions of true‐positive rates (A), false‐positive rates (B), and accuracy (C) across all 12 empirically tested essential proteins, for binding affinity thresholds of −7 kcal/mol (AutoDock Vina), −70 kcal/mol (DOCK6.9), or pK d > 7 (AutoDock Vina with all rescoring functions). White points indicate mean values, and gray bars indicate ranges of 25th to 75th percentile values (Q 1 and Q 3, respectively). The whiskers of the gray box plots indicate ranges of values not considered outliers, that is, those between Q 1 – 1.5 × IQR and Q 3 + 1.5 × IQR, where IQR = Q 3 – Q 1 is the interquartile range.
-
DReceiver operating characteristic (ROC) curves for all 12 empirically tested essential proteins. Essential proteins correspond to the genes indicated and are involved in DNA replication (purple), transcription (orange), metabolism (brown), and cell wall synthesis (green). The black diagonal line indicates the benchmark generated by random guessing. ROC curves are colored according to the model used. Curves for AutoDock Vina (dark blue curves) are identical to those shown in Fig 4D of the main text and are reproduced here to facilitate comparison between models.
-
EArea under the ROC curve (auROC) values for each empirically tested essential protein and each model used.
