-
A
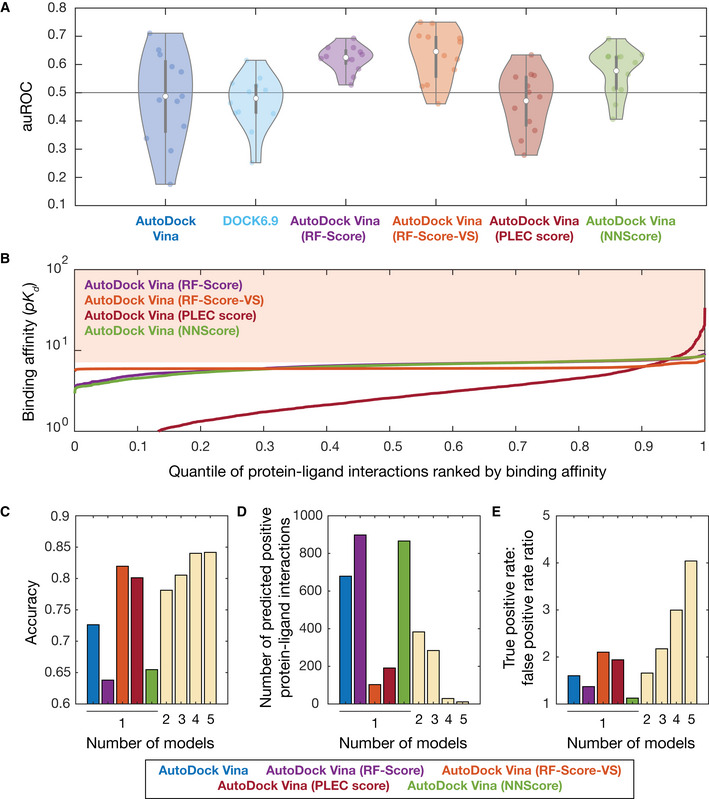
Area under the ROC curve (auROC) values for all 12 empirically tested essential proteins, across different molecular docking programs (AutoDock Vina and DOCK6.9) and different machine learning‐based pose scoring functions (RF‐Score, RF‐Score‐VS, PLEC score, and NNScore). White points indicate mean values, and gray bars indicate ranges of 25th to 75th percentile values (Q
1 and Q
3, respectively). The whiskers of the gray box plots indicate ranges of values not considered outliers, that is, those between Q
1 – 1.5 × IQR and Q
3 + 1.5 × IQR, where IQR = Q
3 − Q
1 is the interquartile range. The horizontal line at 0.5 indicates the benchmark generated by random guessing.
-
B
Rank‐ordered binding affinities (pK
d
) for the protein‐ligand pairs modeled by applying machine learning‐based rescoring functions on AutoDock Vina poses. Curves are colored according to the rescoring function used in (A). The shaded area indicates a binding affinity threshold of > 7.
-
C–E
Dependence of prediction accuracy, number of predicted positives (protein‐ligand interactions), and true‐positive rate/false‐positive rate on the number of models used. Single models, based on AutoDock Vina poses, are colored according to (A) as shown at bottom. Model predictions based on the following rescoring functions were ensembled in sequence: RF‐Score, NNScore, PLEC score, and RF‐Score‐VS.

