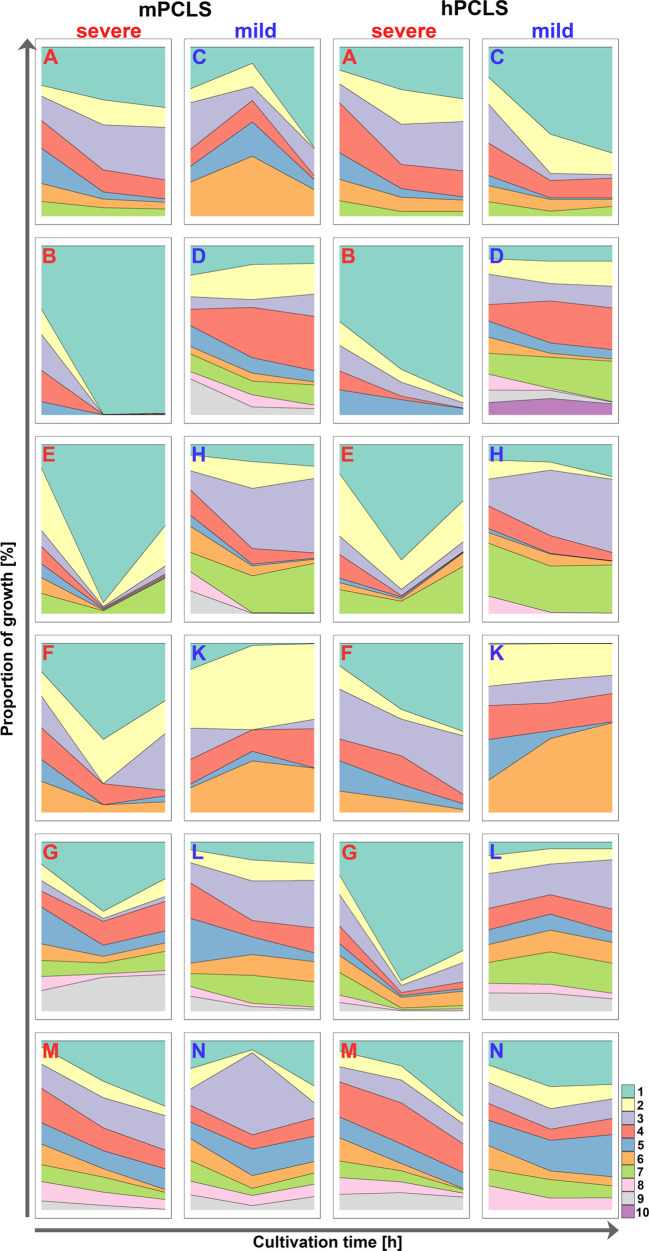
Figure 3.
Relative proportions of serial isolates during competitive growth in murine (left) and human PCLS (right) after 4 hours and 8 hours. For each serial isolate of the twelve longitudinal courses, its fraction in the clonal community at the time points 0 h, 4 h and 8 h is shown. Longitudinal courses are differentiated by a bold letter (severe courses in red; mild courses in blue). Each serial isolate is depicted by color sorted by increasing colonization time of the clone in the patient’s lungs. For more detailed information see Supplementary Dataset S1 . For outcome of the second biological replicate see Supplementary Figure S2 .

