
Figure 2.
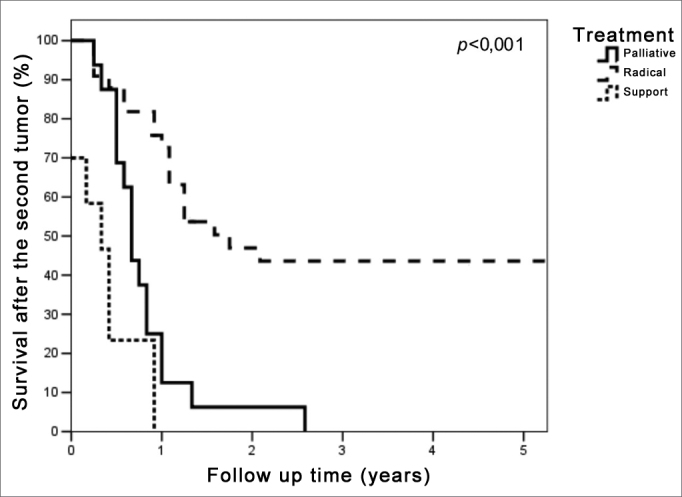
Survival curves after second primary curves according to the type of treatment of the second tumor.
Official websites use .gov
A
.gov website belongs to an official
government organization in the United States.
Secure .gov websites use HTTPS
A lock (
) or https:// means you've safely
connected to the .gov website. Share sensitive
information only on official, secure websites.
Survival curves after second primary curves according to the type of treatment of the second tumor.