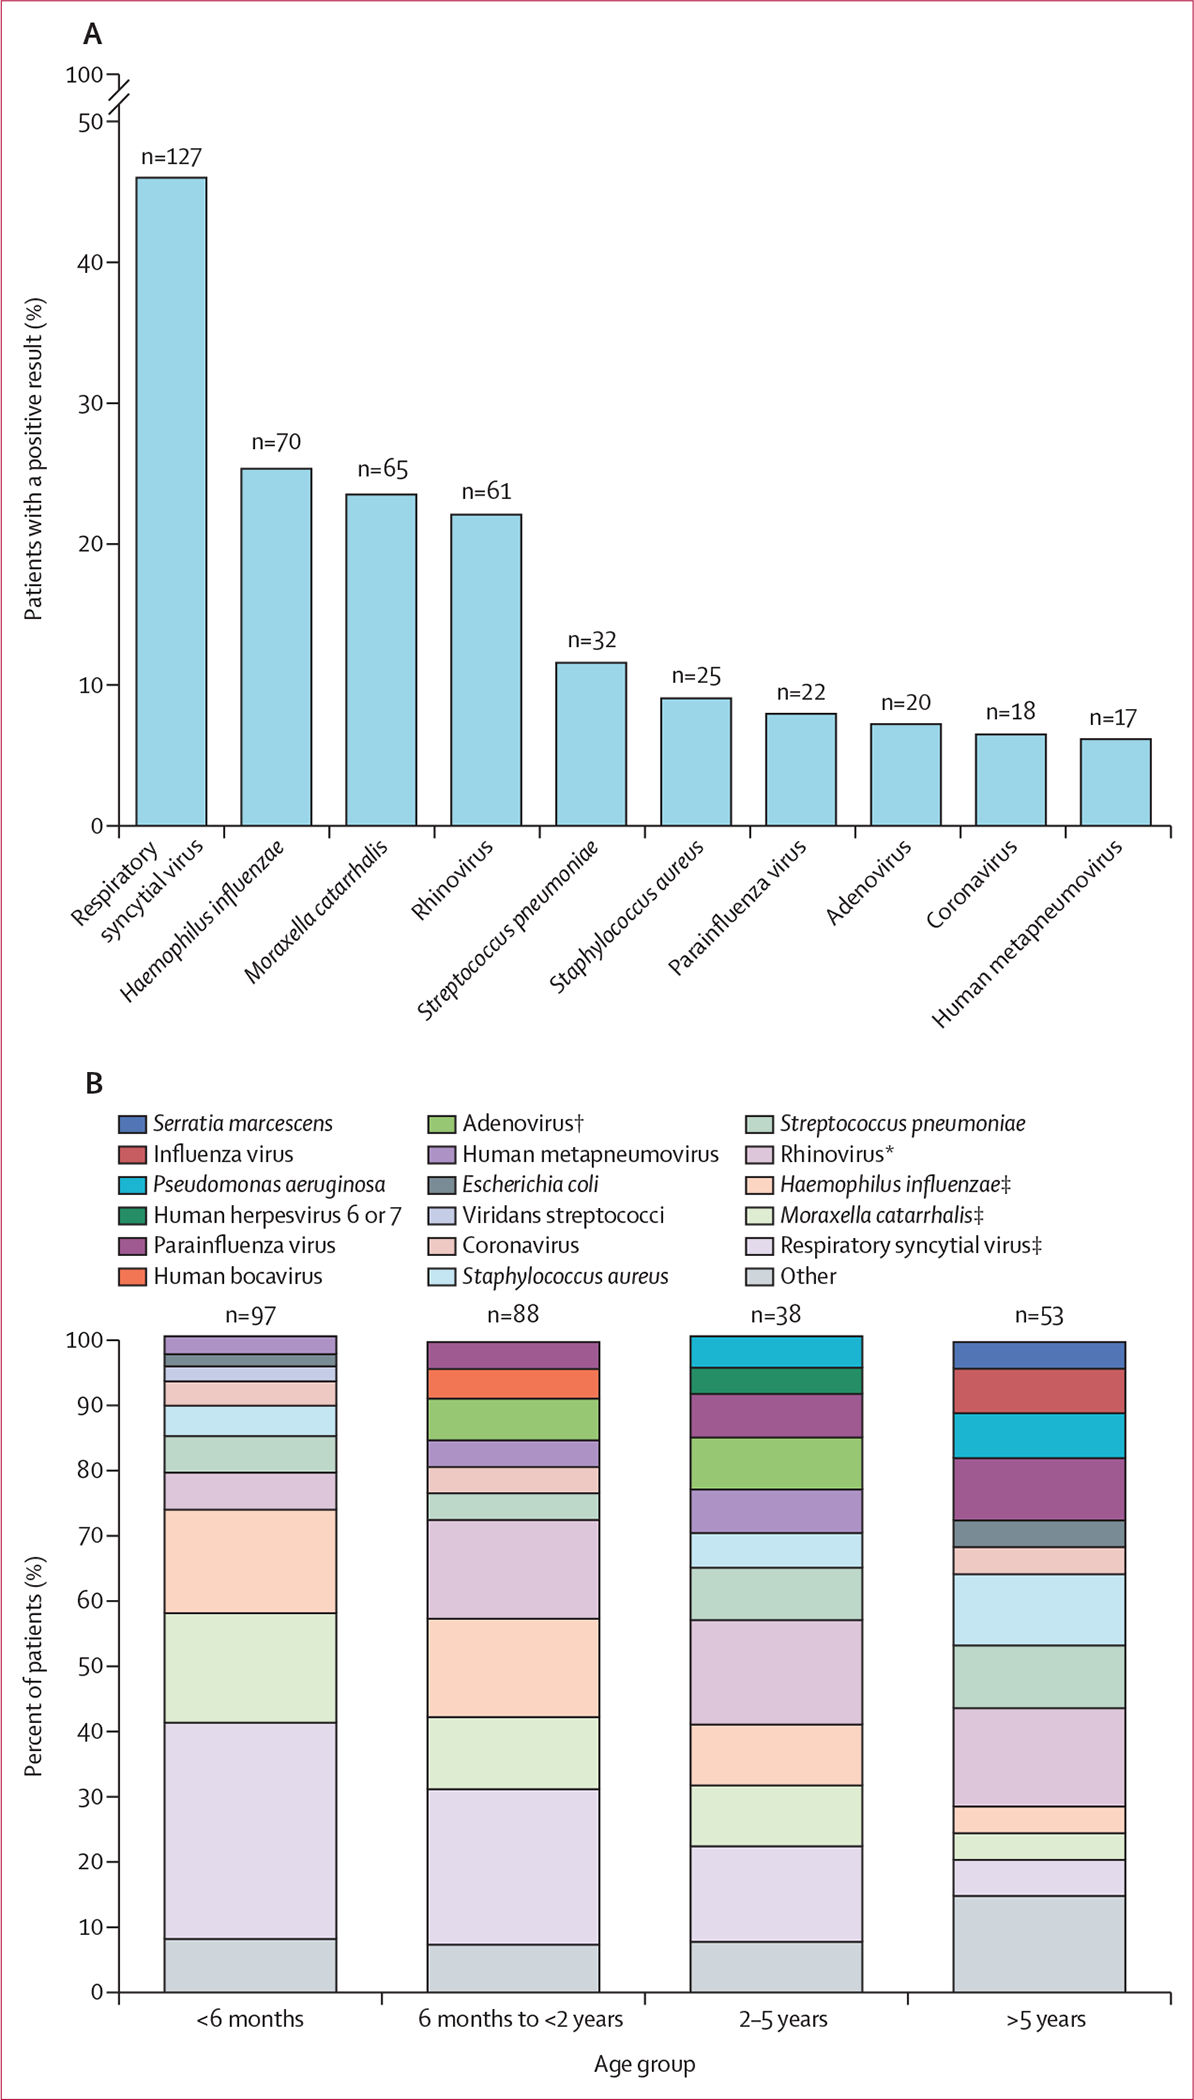
Figure 2: Pathogens detected in children with definite or suspected lower respiratory tract infections.

(A) Numbers (above bars) and percentages (bars) of patients with a positive result for each indicated pathogen by any method. Multiple pathogens from the same patient are included. (B) Proportions of the ten pathogens detected most frequently in each age group, with remaining pathogens grouped as other. In age groups in which there were multiple pathogens with equal numbers detected as the tenth most common pathogen, more than ten pathogens were included. Proportions are calculated as the number of cases of a given pathogen out of the total number of cases in the age group (children might have been counted more than once if they had multiple pathogens present). Statistical significance was determined by χ2 test. *p<0·05. †p<0·01. ‡p<0·001.
