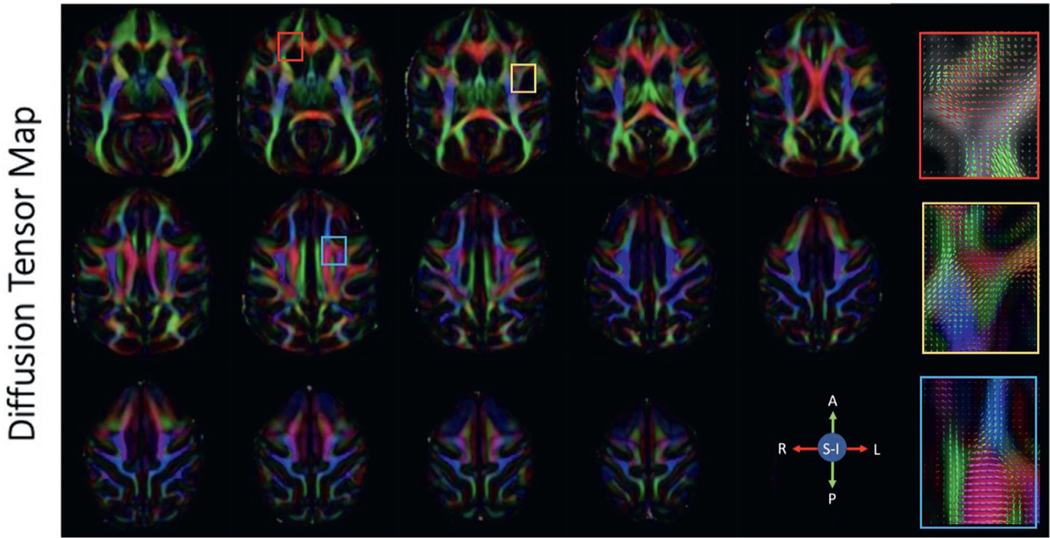
Fig. 7. Diffusion tensor maps.
Selected axial slices showing the principal diffusion direction in a single subject acquired at 0.58 mm isotropic resolution. Red, green and blue represent fibers traveling right-left, anterior-posterior and superior-inferior respectively. The colored boxes correspond to the fiber orientation distribution functions displayed on the right.

