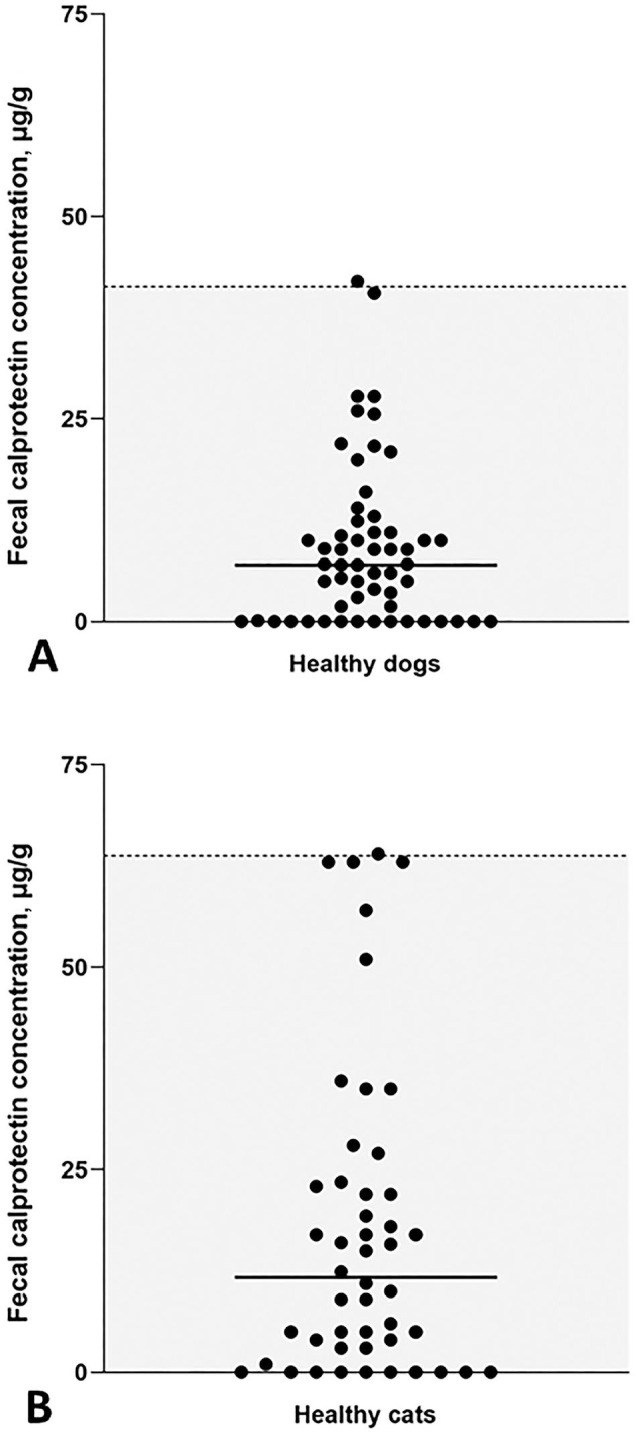
Figure 2.

RIs for canine and feline fCal concentrations using the fCAL turbo assay. Scatter plots of fCal concentrations measured in the reference populations of A. 57 healthy dogs and B. 48 healthy cats. Each symbol represents the concentration of a specific dog or cat sample. Median fCal concentrations (solid horizontal lines) and RIs (gray shaded portion below the dashed horizontal line) were calculated.
