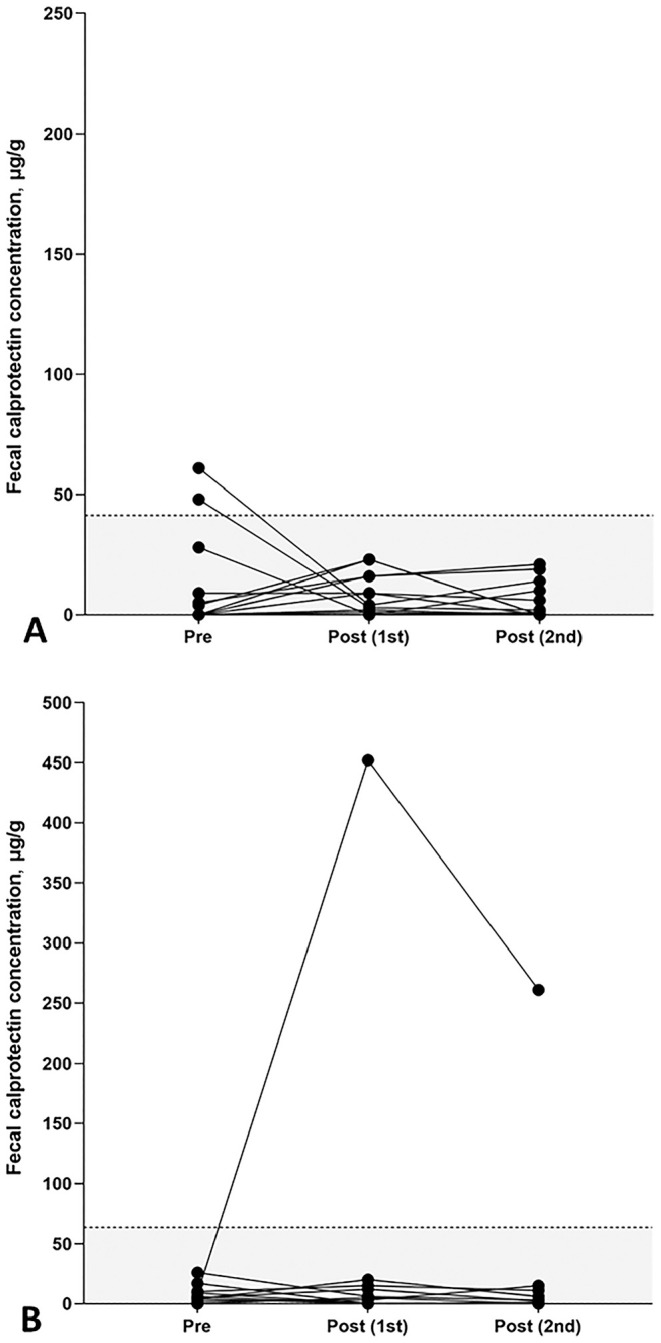
Figure 5.

Serial fCal concentrations in NSAID-treated dogs and cats. A. No statistically significant changes in fCal concentrations were detected in 14 canine patients during (post 1st; median: 4 µg/g, range: 3–23 µg/g) or after (post 2nd; median: 1 µg/g, range: 3–21 µg/g) NSAID treatment compared to pretreatment fCal concentrations (median: 3 µg/g, range: 3–61 µg/g; p = 0.337). B. In cats, no significant changes in fCal concentrations were detected during (post 1st; median: 5 µg/g, range: 0–452 µg/g) or after (post 2nd; median: 3 µg/g, range: 0–261 µg/g) NSAID treatment compared to pretreatment fCal concentrations (median: 6 µg/g, range: 3–26 µg/g; p = 0.483), but a marked increase in fCal concentrations during (452 μg/g) and after (261 μg/g) NSAID treatment was seen in 1 cat. Each symbol represents the fCal concentration for a specific dog or cat and time. RIs are indicated by the gray shaded portions below the dashed horizontal lines.
