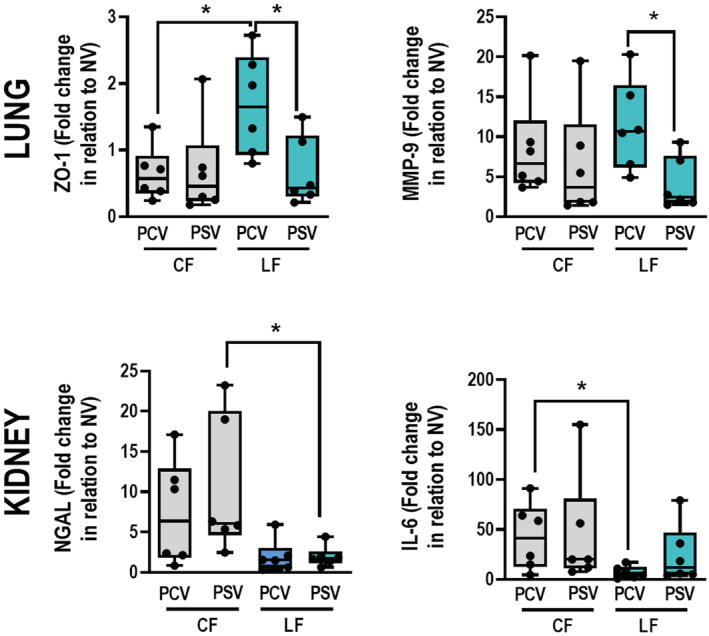
FIGURE 4.

Molecular biology of lung and kidney. Gene expression of ZO‐1 and MMP‐9 in lung tissue; and KIM‐1, NGAL, and IL‐6 in kidney tissue. Boxplots represent the median and interquartile range of 6 animals per group. Comparisons were done by Kruskal–Wallis test followed by Dunn's multiple comparisons test (p < 0.05). CF, conservative fluid therapy; IL‐6, interleukin‐6; KIM‐1, kidney injury molecule 1; LF, liberal fluid therapy; MMP‐9, metalloproteinase‐9; NGAL, neutrophilic gelatinase‐associated lipocalin; PCV, pressure‐controlled ventilation; PSV, pressure‐support ventilation; ZO‐1, zona occludens‐1; *, depicting the differences between groups (p < 0.05).
