
FIGURE 7.
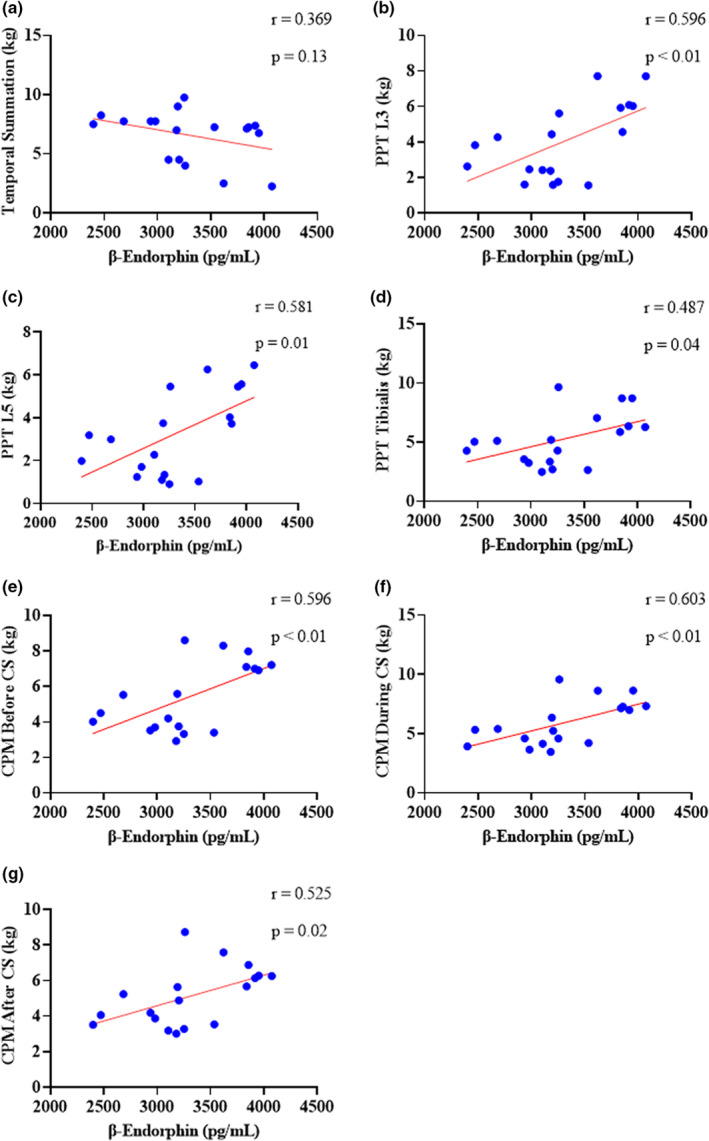
Correlation between plasma β‐endorphin and quantitative sensory tests in patients with chronic nonspecific low back pain. The competitive ELISA technique indicates that the lower the value of β endorphin (pg), the higher the concentration of plasma β endorphin in the sample. The graphs show a Pearson correlation between plasma β endorphin and: (a) Temporal summation; (b) PPT measured at L3; (c) PPT measured at L5; (d) PPT measured in tibialis anterior; (e) CPM before conditioning stimulus; (f) CPM during the conditioning stimulus; (g) CPM after conditioning stimulus. CPM, conditioned pain modulation; CS, conditional stimulus; PPT, pressure pain threshold; TS, temporal summation of pain.