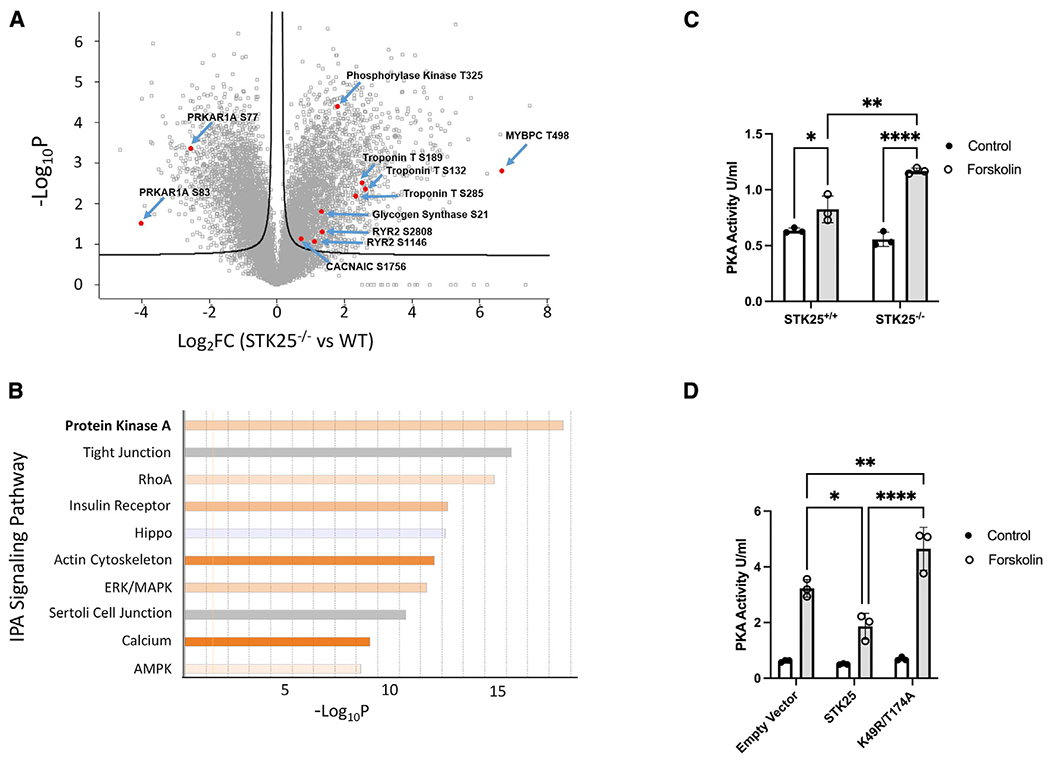
Figure 1. STK25 inhibits PKA activity.

(A) Differential phosphoproteomic spectra of STK25+/+ and STK25−/− cardiomyocytes. Members of the PKA signaling pathway are highlighted.
(B) Ingenuity phosphoprotein pathway analysis. Orange indicates pathways upregulated in STK25−/− cardiomyocytes, while blue indicates upregulation in STK25+/+.
(C) PKA activity in response to 10 μM forskolin treatment for 30 min in STK25+/+ and STK25−/− cardiomyocytes. n = 3 for each condition.
(D) PKA activity in response to 10 μM forskolin treatment for 30 min in HEK293T cells overexpressing either empty vector, wild-type STK2,5 or kinase-dead K49R/T174A. n = 3 for each.
Bar graph data are represented as mean ± SD and analyzed in technical triplicates, *p < 0.05, **p < 0.01, ****p < 0.0001 using ANOVA and Tukey’s adjustment for multiple comparisons.
