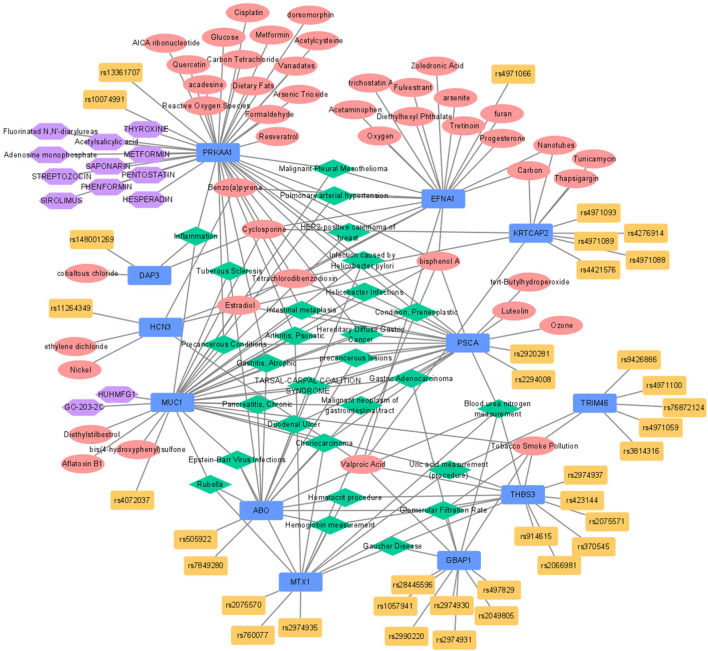
FIGURE 2.
Functional network analysis for expression-regulated genes from eQTL identified by GBA. Blue, red, yellow, green, and purple nodes stood for genes, chemicals, SNPs included in GBA, disease-networks, and drugs, respectively. eQTL, expression quantitative trait loci; GBA, gene-based analysis; SNP, single nucleotide polymorphism.

