FIGURE 2.
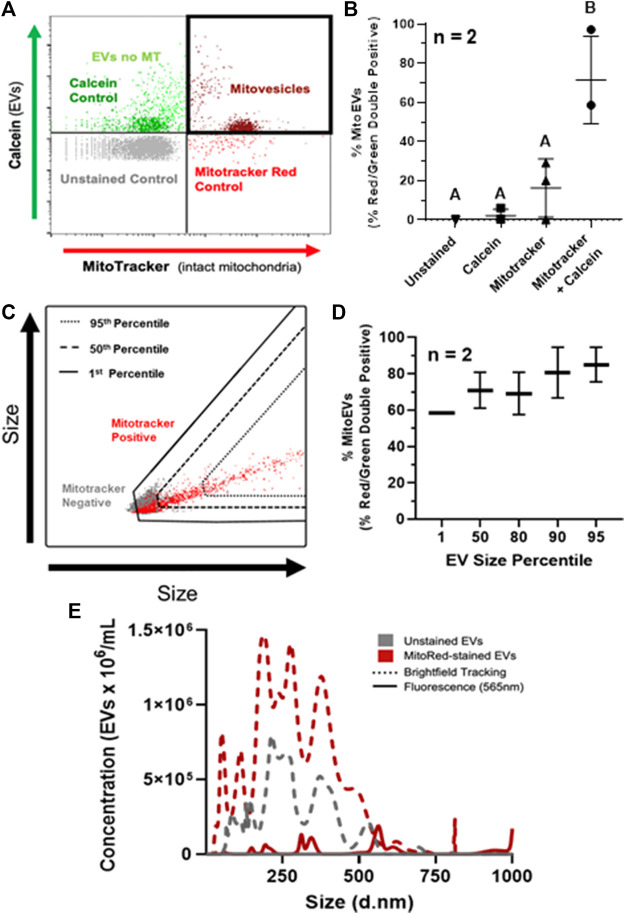
MSC-derived EVs contain mitochondria (MT). (A) Events fluorescing above control thresholds for Calcein AM (Green) and Mitotracker (Red) on flow cytometry were classified as EVs containing intact MT (i.e., mitoEVs; dark red). (B) Quantification of mitoEVs (red-green double positive events) and three control groups; Mitotracker only (▴), calcein only (■), and unstained control (▾), compared to EVs stained with calcein + Mitotracker (●). (C) Representative flow plot depicting backgating strategy for assessing relative sizes of mitoEVs (red) and MT-negative EVs (gray). (D) Backgating revealed that EVs of all sizes contain MT, but EVs lacking MT are generally small, and the majority of the largest EVs contain MT. (E) Fluorescent NTA revealed mitoEVs (solid red line) trend larger than the general EV population (dotted lines) and cluster into distinct sub-groups. Groups that do not share letters (Panel B) are significantly different (p ≤0.05) by one way ANOVA.

