FIGURE 3.
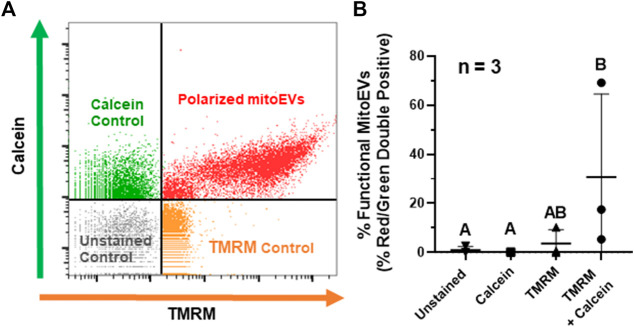
A subset of MitoEVs contain functional mitochondria. (A) Representative flow plot identifying polarized mitoEVs; events fluorescing above control thresholds for calcein AM (green) and TMRM (orange) were classified as mitoEVs containing functional MT (red). (B). Quantification of functional mitoEVs (red-green double positive events) and three control groups; TMRM only (▴), calcein only (■), and unstained control (▾), compared to EVs stained with calcein + TMRM (●). Data is expressed as the fraction of double-positive events in each group. of percent red/green double positive showed statistically significant differences between the double stained experimental group and single color/unstained controls Groups that do not share a letter are significantly different (n = 3, p ≤0.05) by one-way ANOVA.

