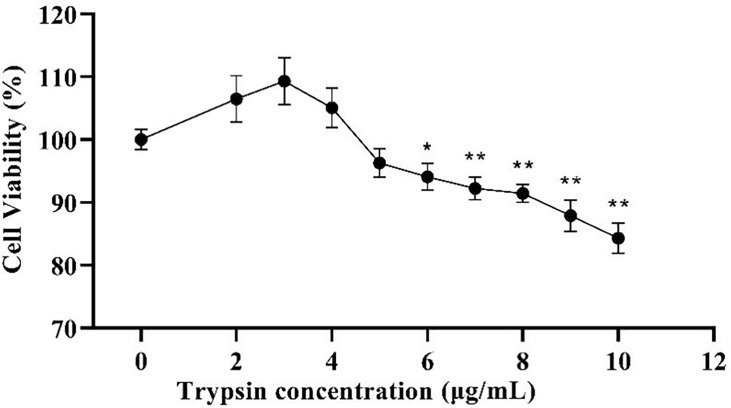
Figure 1.
Effects of different trypsin concentrations on the viability of ST cells. * indicates that the difference is significant (P < 0.05) compared with the group added with 0 μg/mL trypsin, ** indicates that the difference is extremely significant (P<0.01), and no indication indicates that the difference is not significant (P > 0.05), n=6.

