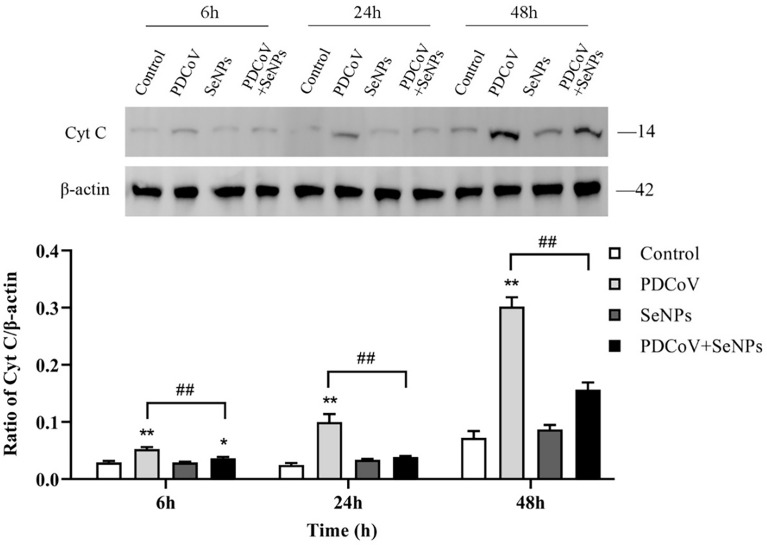
Figure 9.
Effects of SeNPs on Cyt C content in the cytoplasm of ST cells infected with PDCoV. Top is immunoblot bands of Cyt C in each treatment group at 6, 24, and 48 h. At the bottom is a histogram after analyzing and calculating the ratio of grayscale values of Cyt C. * indicates that the difference is significant compared with the control group (P < 0.05), ** indicates that the difference is extremely significant compared with the control group (P < 0.01); ## indicates that there is a significant difference between the PDCoV group and the PDCoV + SeNPs group (P < 0.01), and there is no significant difference (P > 0.05) in the unlabeled expression, n=3.

