
FIGURE 2. CD11bhigh B cells are increased to both young and aged brains as early as post-MCAO day 7.
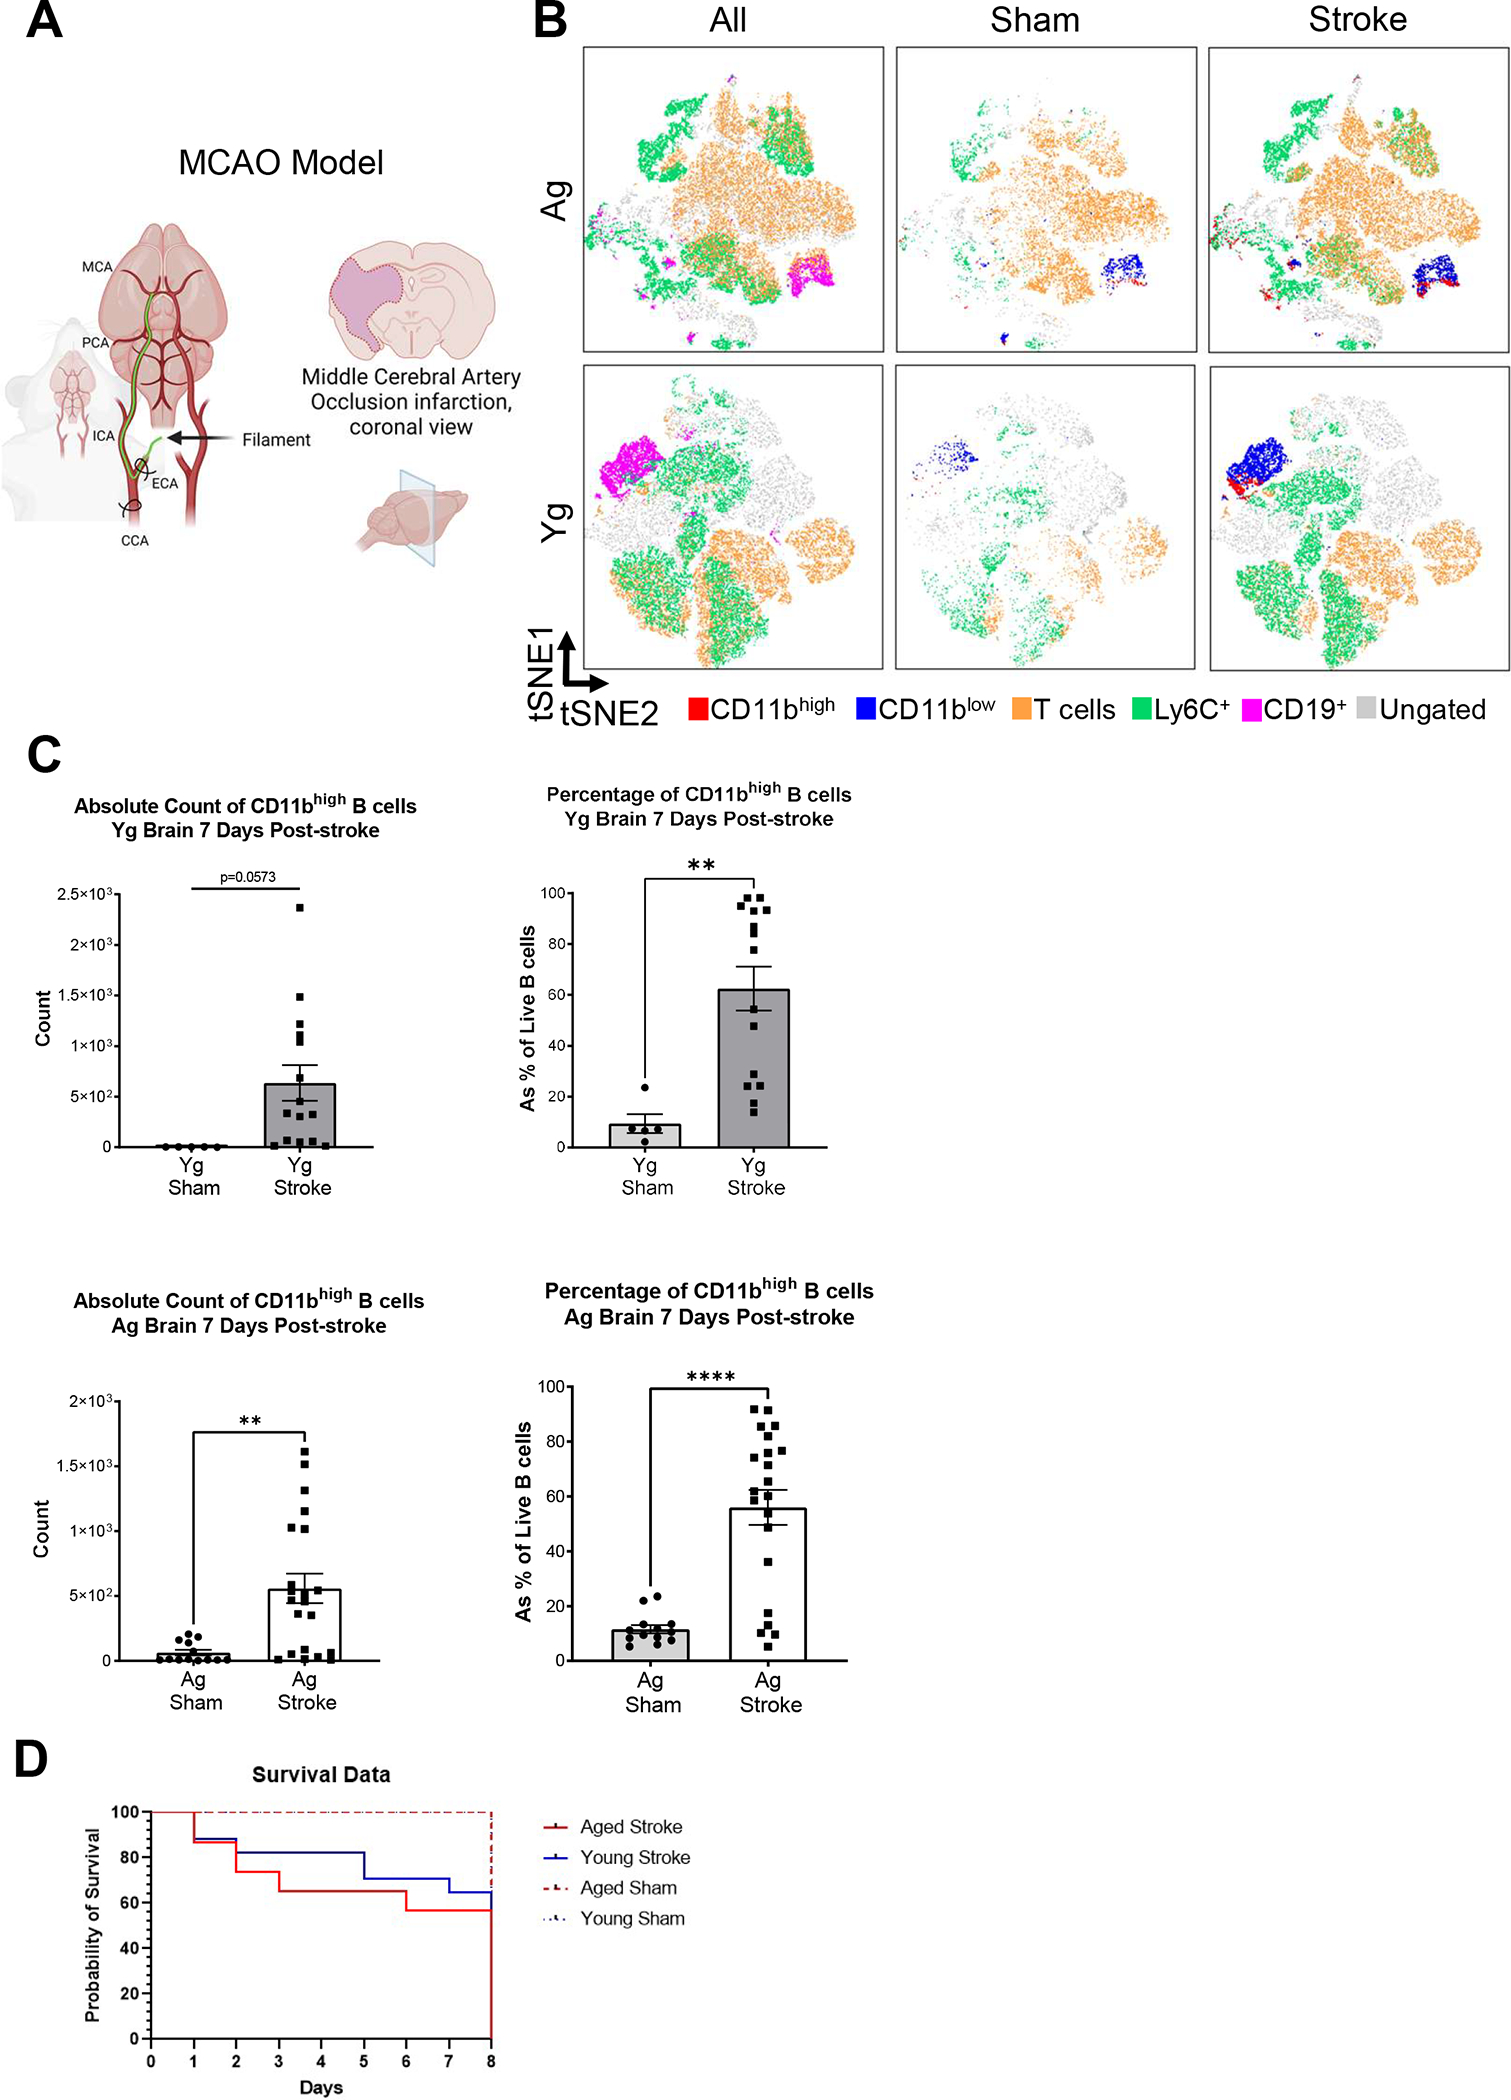
(A) Schematic of the MCAO model used for inducing neurological injury in mice. (B) tSNE plots of live CD45high cells (non-MG immune cells) from sham and stroked homogenized brain from Yg and Ag mice, demonstrating CD19+ B cells (pink), CD11bhigh B cells (red), CD11blow B cells (blue), CD3+ T cells (orange), Ly6C+ monocytes (green), and ungated populations (gray), indicating the increase in CD11bhigh B cells after stroke when compared to sham in both Yg and Ag MCAO mice. (C) Quantification of CD11bhigh and CD11blow B cells isolated from brain, comparing the absolute counts and percentage of CD19+ cells from sham controls to the ipsilateral hemisphere in stroked animals. Conducted in both Yg (n=5–15) and Ag mice (n=13–21). Left the ipsilateral stroked hemisphere in Ag animals demonstrate a significant increase in CD11bhigh B cells (p=0.0019) with Yg cells trending upwards in number (p=0.0573). Right the ipsilateral stroked hemisphere in Ag and Yg animals demonstrate a significant increase in the percentage of CD11bhigh B cells within the total CD45+/CD19+ B cell population (p<0.0001, p=0.0027 respectively). (D) Representative Kaplan-Meier Curve for MCAO mortality in aged and young mice. Results compiled from 6 independent experiments. Outlier test ROUT Q=1% was performed on Yg and Ag groups, resulting in the removal of 1 Yg sham and 2 Yg stroke samples. Outliers where removed before analysis. Unpaired analysis T-test, mean ± SEM. *p < 0.05, **p < 0.01, ***p < 0.001, ****p < 0.0001, N.S. not significant.