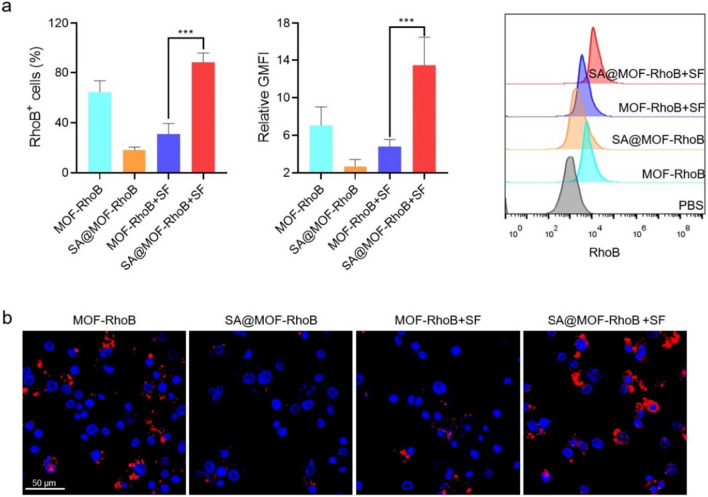
Fig. 3.
Cellular uptake of MOF-RhoB and SA@MOF-RhoB by RAW264.7 cells. a RhoB fluorescence intensity of RhoB-positive RAW264.7 cells detected by flow cytometry. b The RhoB fluorescence in RAW264.7 cells with the treatment of different formulations by CLSM. MOF-RhoB + SF indicated that MOF-RhoB treated with gastrointestinal tract simulation fluid (pH value arranged from 1.5 to 7.4). SA@MOF-RhoB + SF indicated that SA@MOF-RhoB treated with gastrointestinal tract simulation fluid (pH arranged from 1.5 to 7.4). The blue indicated the cell nucleus. ***P < 0.001

