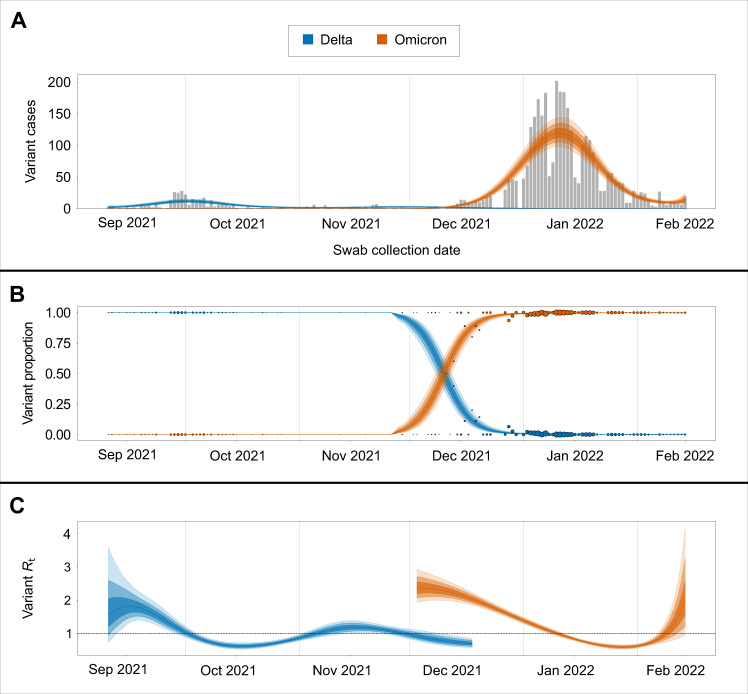
Fig. 4. Transmission dynamics of Delta and Omicron over study period.
A SARS-CoV-2-positive samples (gray bars) against posterior variant-specific incidence over the study period. B Observed variant proportion of sequenced positive SARS-CoV-2 samples against posterior variant proportion. Radius of points corresponds to counts of sequenced samples for that day. C Posterior estimates of variant-specific effective reproduction numbers. Shaded intervals in all plots correspond to 50%, 80%, and 95% credible intervals.

