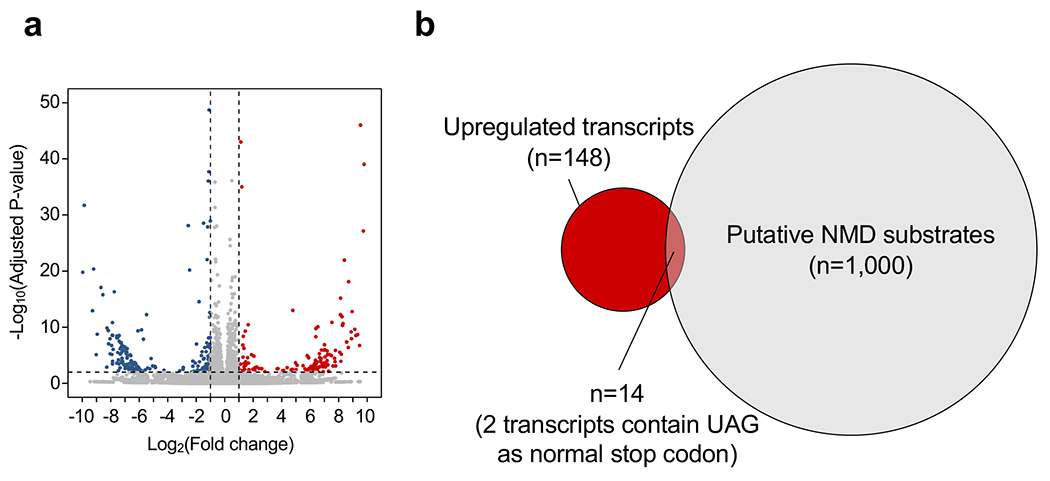
Extended Data Figure 9. mRNA-seq analysis on human fibroblasts.

Cells were infected with Lenti.sup-tRNATyr.EGFP or Lenti.EGFP as control for seven days as described in Fig. 2a. a, Volcano plot showing differentially expressed transcripts in Lenti.sup-tRNATyr.EGFP-treated cells compared to control cells. Red and blue dots denote significantly upregulated and downregulated transcripts (adjusted p<0.01 and fold change>2), respectively. b, Venn diagram showing the upregulated transcripts in a and published set of 1,000 human putative NMD substrates.
