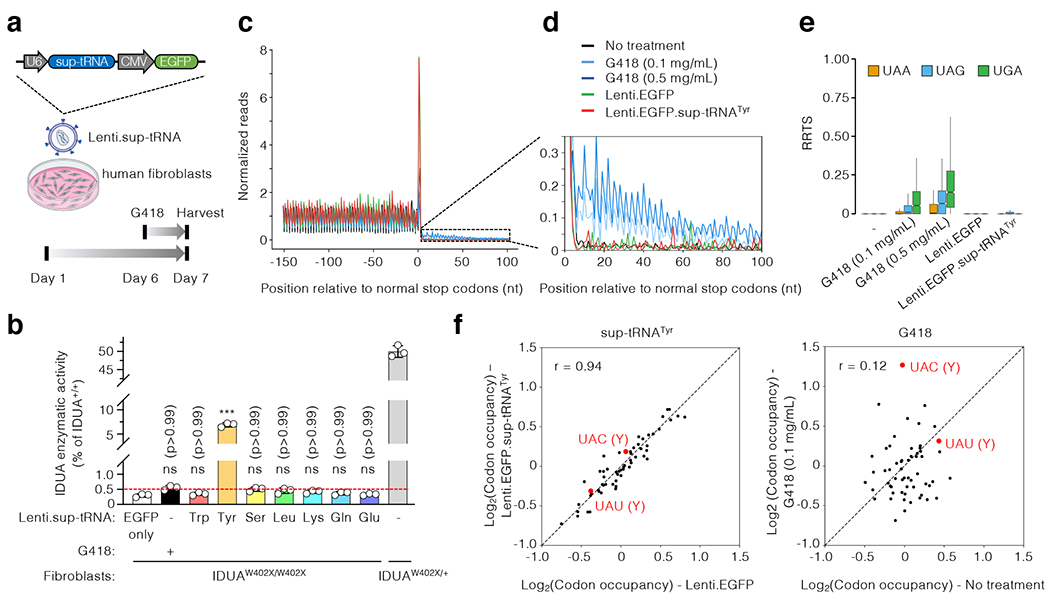
Figure 2. Functional characterization of sup-tRNA in MPS-I patient fibroblasts.

a, Workflow to examine readthrough of the endogenous IDUA-W402X mutation in human fibroblasts by G418 or lentiviral vectors expressing sup-tRNA (Lenti.sup-tRNA). The Lenti.sup-tRNA construct is shown. b, IDUA activity assay in fibroblasts from an MPS-I patient carrying homozygous IDUA-W402X mutation (IDUAW402X/W402X) or carrier (IDUAW402X/+), treated with or without readthrough agent. The y-axis denotes relative activity normalized to untreated IDUAW402X/+ as 50% of normal level (IDUA+/+). Red dashed line indicates that 0.5% of normal IDUA activity was associated with attenuated disease (see text for details). Data are mean ± s.d. of three biological replicates. c, Metagene plot showing normalized reads of ribosome protected fragments (RPFs) relative to the distance from the normal stop codon at position 0. RPFs from untreated MPS-I patient fibroblasts (black), or cells treated for 24 hr with G418 (light blue: 0.1 mg/mL; dark blue: 0.5 mg/mL), Lenti.EGFP (green), or Lenti.EGFP.sup-tRNATyr (red) are overlaid. d, Magnified view of the 3′ untranslated region (UTR) showing increased RPFs in this region in G418-treated cells, but not in cells treated with sup-tRNATyr. e, Box plot of ribosome readthrough score (RRTS) derived from ribosome profiling of patient fibroblasts treated under indicated conditions. Representative results of two biological replicates are shown. RRTS values were calculated for transcripts harboring different normal stop codons, namely UAA (orange), UAG (blue), and UGA (green), respectively. Center line indicates the median, the box ends indicate the first and third quartiles, and the whiskers indicate the range of the remaining data excluding outliers. f, Scatter plots showing RPF densities at each codon (codon occupancy) in patient fibroblasts under indicated conditions. Two tyrosine (Y) codons are highlighted in red. Statistical analysis was performed by one-way ANOVA followed by two-sided Dunnett’s multiple comparisons test (b). ***p < 0.001, ns: not significant.
