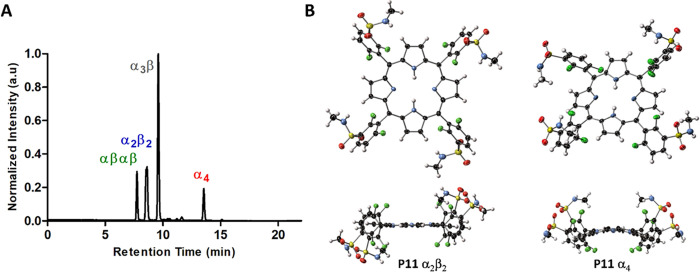
Figure 2.
Separation and X-ray crystal structures of redaporfin atropisomers. (A) Representative RP-HPLC chromatogram of redaporfin where the individual atropisomers were detected by absorption at 743 nm. (B) View of the molecular structure in the crystal of α2β2 and α4 atropisomers of P11, where the α2β2 and the α4 atropisomers were obtained from α2β2·2Me2SO and α4·4MeCN, respectively (ellipsoids are shown at the 50% probability level, and H-atoms are represented as spheres of fixed radius).

