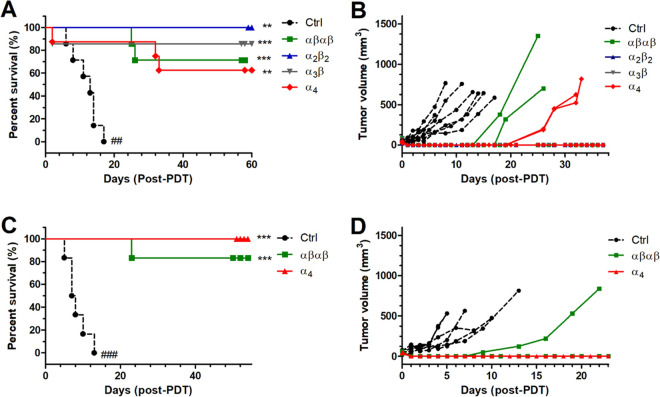
Figure 8.
Vascular-PDT (DLI = 15 min) of BALB/c mice bearing CT26 tumors with 0.45 mg/kg redaporfin atropisomers and 40 J/cm2 at 750 nm. (A) Survival curves for treatment groups with 6–8 female mice. (B) Tumor volume for each individual female mouse until the endpoint was reached. (C) Survival curves for treatment groups with 6 male mice. (D) Tumor volume for each individual male mouse until the endpoint was reached. The significance level between the different treated groups was evaluated by Log-rank (Mantel–Cox) test vs Ctrl (* p < 0.05, ** p < 0.01, and *** p < 0.001) or α4 (## p < 0.01 and ### p < 0.001).

