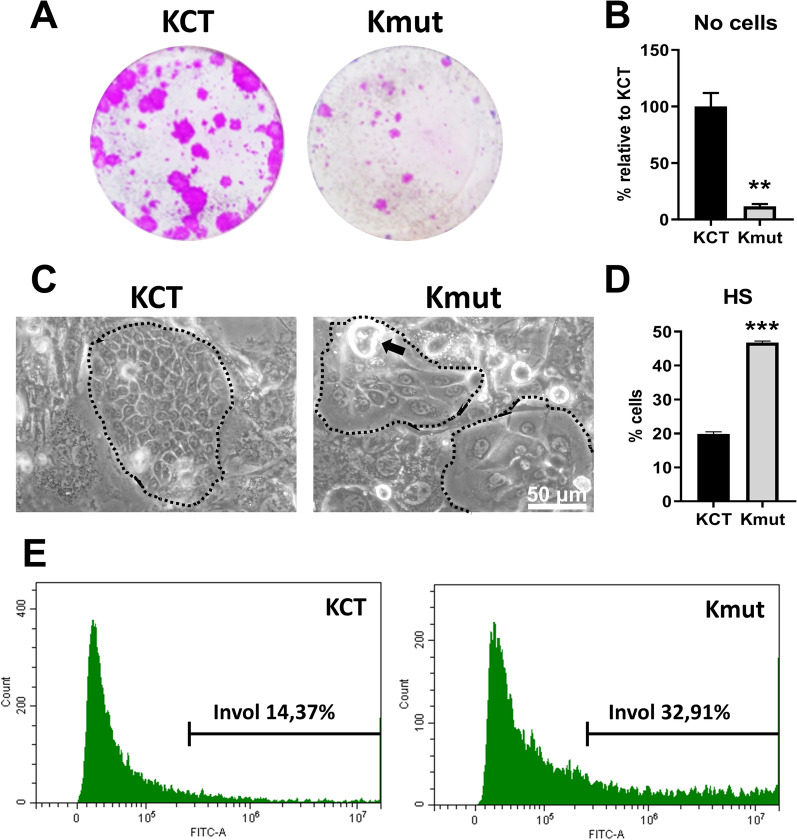
Fig. 2.
N856H Kv10.2 mutant primary cells isolated from the patient display a strong growth defect and enhanced terminal differentiation. Healthy keratinocytes from two healthy infantile donors were used as control (KCT) compared with mut keratinocytes containing the mutation (Kmut). A Representative clonal expansion, as monitored by clonogenicity assays (n = 3 triplicates per essay, 2 essays per healthy strain). B Number of cells harvested in A at confluence of healthy strains, relative to KCT (n = 2, 2 essays per healthy strain). C Representative phase contrast microphotograph of KCT or Kmut cells as indicated. Dotted lines enclose keratinocyte colonies, surrounded by a fibroblastic feeder layer (see “Materials and methods”). Black arrow points to a typical detaching differentiated cell that were very frequent in the mutant cultures. Scale bar, 50 μm. D Bar histogram shows the percentage of cells with high size and complexity, by light scattering parameters (HS), typical of differentiated keratinocytes, as quantified by flow-cytometry (n = 2, as in A). E Expression of the epidermoid differentiation marker involucrin n KCT or Kmut, as indicated, measured by immunodetection and flow cytometry (representative of 3 independent essays). **p < 0.01, ***p < 0.001

