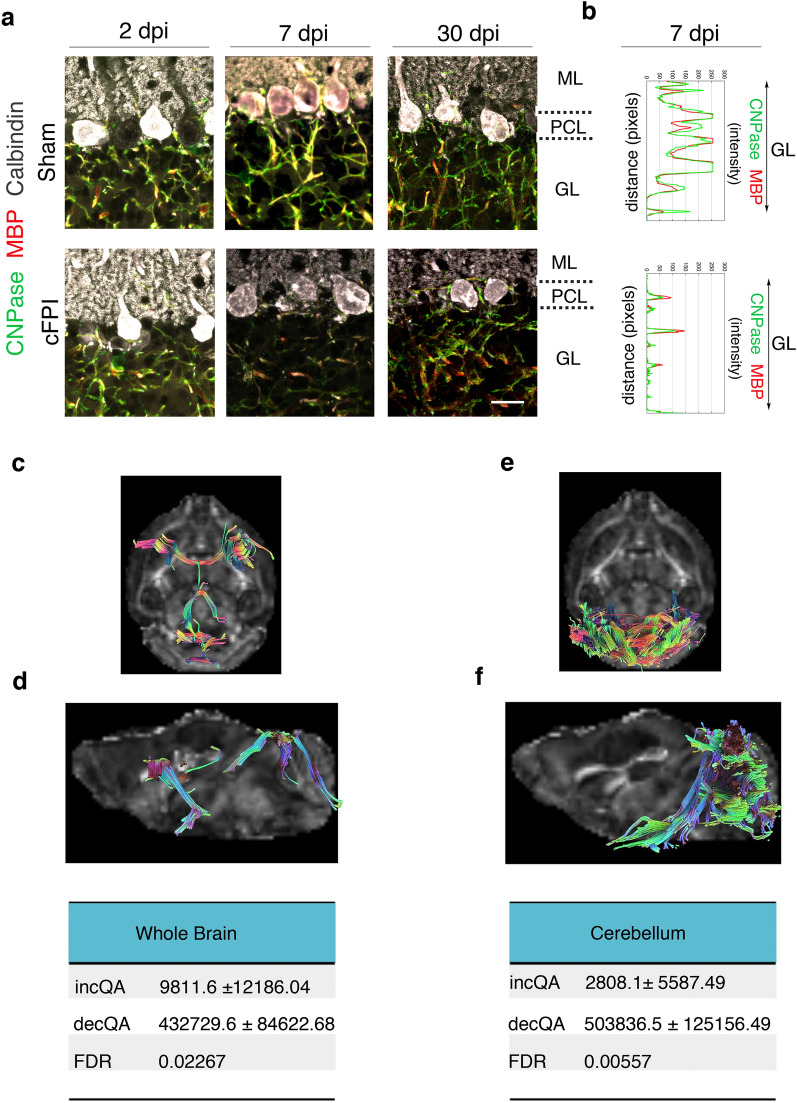
Fig. 6.
Reduced myelin proteins and quantitative anisotropy in the mouse brain following TBI. a Confocal images showing triple labelling of CNPase (green), MBP (red), and calbindin (grey) of Purkinje cells of sham and cFPI mice at 2, 7 and 30 dpi, scale bar 10 μm. b Fluorescence intensity profiles of MBP (red) and CNPase (green) expression in the granular layer (GL) of sham-injured and cFPI mice cerebellum at 7dpi. c–f Representative fiber tracts with decreased QA in the whole brain (c) and cerebellum (f) of injured mice longitudinally traced from one day to seven days after the injury. c, d In the whole brain, obtained from an average number of tracts with increased QA signal 9811.6 ± 12,186.04 and an average number of tracts with decreased QA signal 432,729.6 ± 84,622.68, FDR for tracts visualized 0.002; e, f In the cerebellum, obtained from an average number of tracts with increased QA signal 2808 ± 15,587.49 and an average number of tracts with decreased QA signal 503,836.5 ± 125,156.49, FDR 0.005. QA Quantitative anisotropy, FDR False discovery rate, ML molecular layer; PCL Purkinje cell layer, GL granular layer, dpi days post-injury, CNpase 2′,3′-cyclic nucleotide 3′-phosphodiesterase, MBP myelin basic protein

