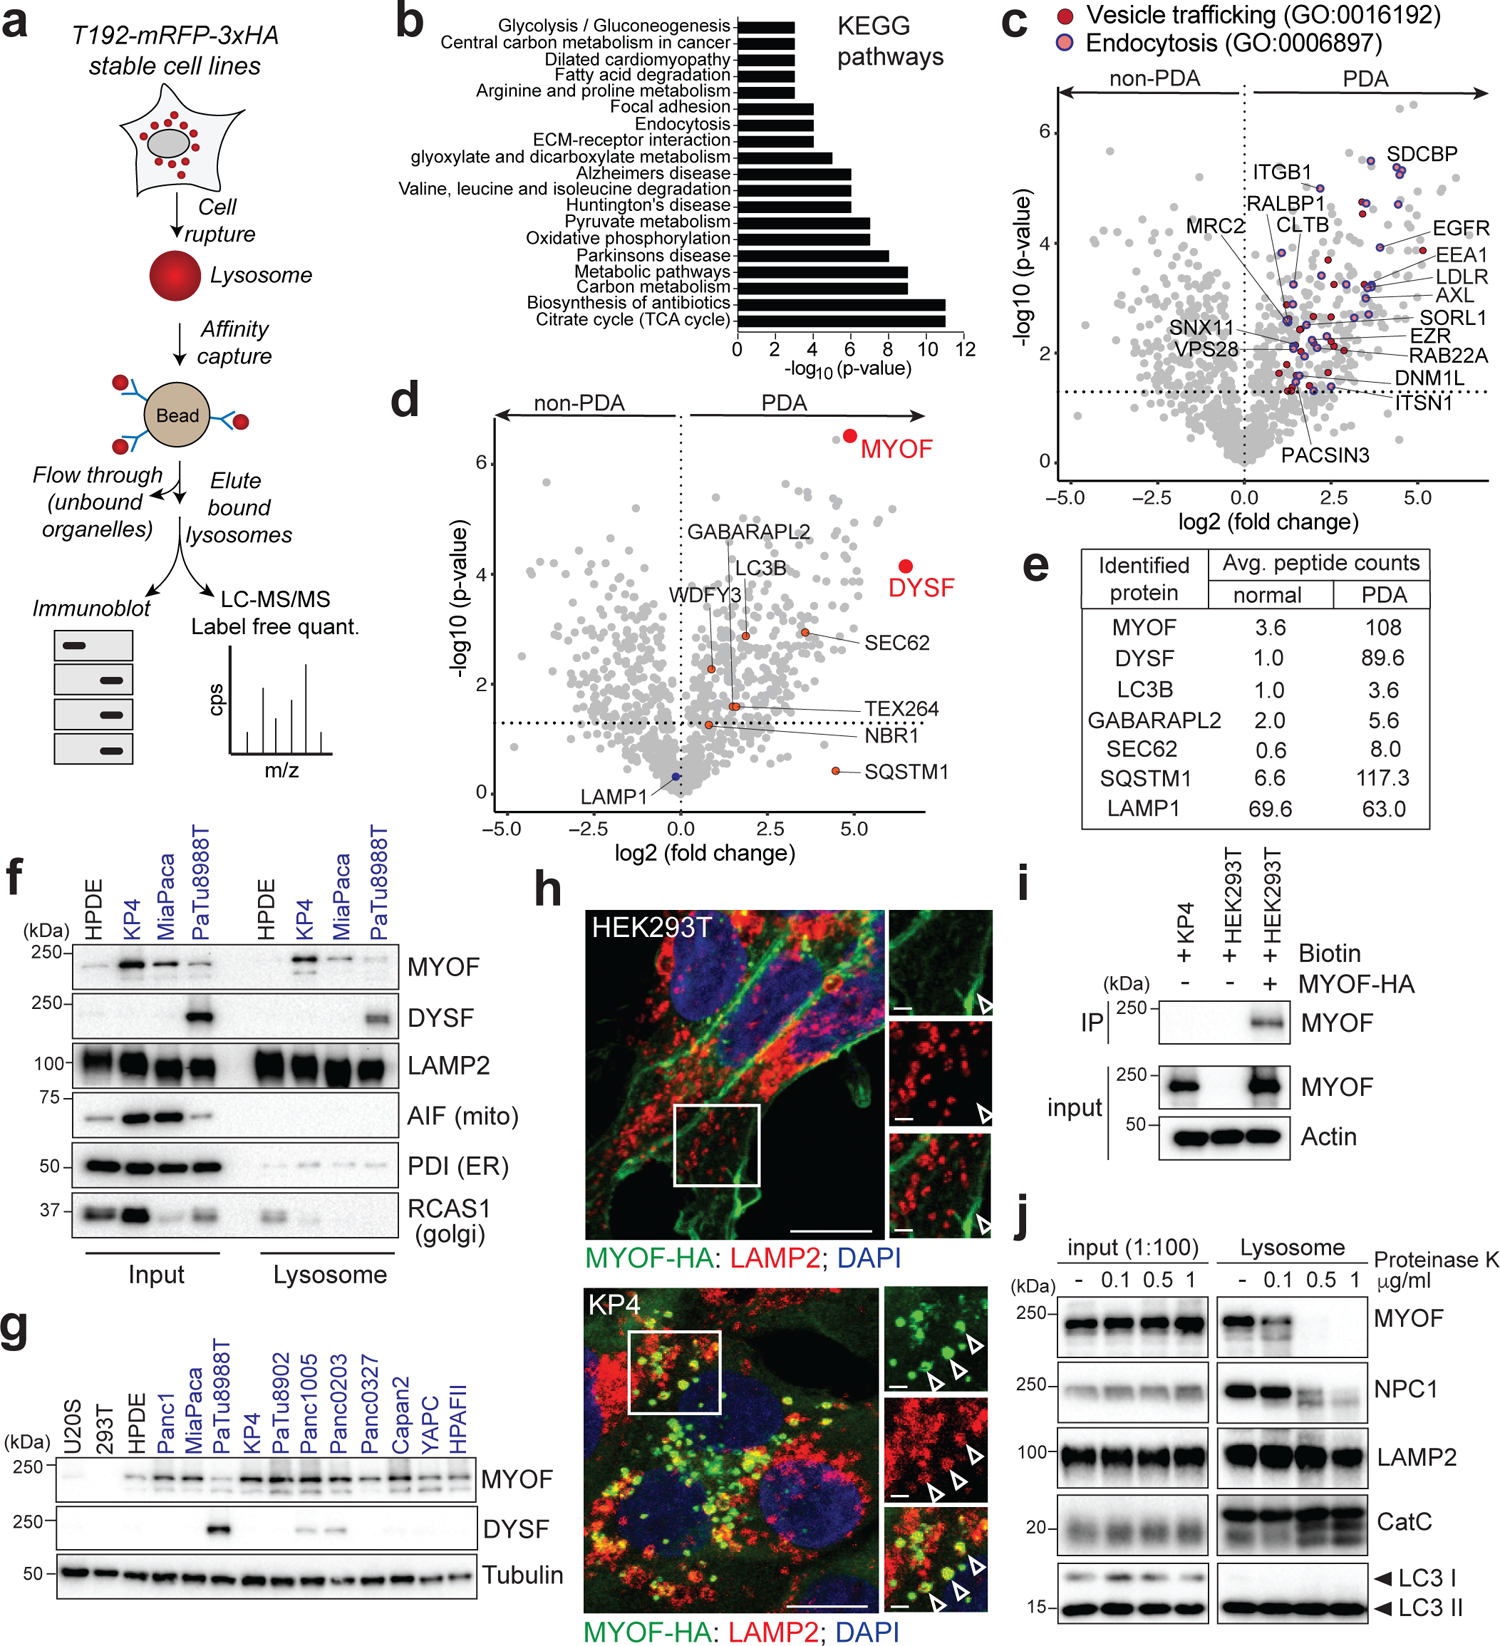
Fig. 1 |. Organelle proteomics identifies the Ferlin repair factors as PDA specific lysosome associated membrane proteins.

a. Schematic showing lysosome purification using affinity-based capture from cells stably expressing T192-mRFP-3xHA. b. KEGG pathway analysis of ≥2-fold enriched PDA lysosome associated proteins. c. Volcano plot of lysosome proteomics data from non-PDA (HEK293T) and PDA (PaTu8988T) cells. Data are plotted as log2 fold change (PDA/non-PDA) versus the -log10 of the p-value. ≥2-fold enriched proteins associated with “vesicle mediated trafficking” are indicated in dark red and overlapping proteins associated with ”endocytosis” are indicated in pink/blue (see supplementary table 1). d. Identical volcano plot as in (c) indicating autophagy related proteins (orange) and MYOF and DYSF (red). e. Average peptide counts for the indicated proteins from n = 3 biological replicates. f. Immunoprecipitation of purified lysosomes from the indicated cell lines showing enrichment of MYOF and DYSF in PDA lysosome fractions. LAMP2 serves as a loading control while absence of AIF, PDI and RCAS1 confirm organelle purity. g. Immunoblot showing levels of MYOF and restricted expression of DYSF in the indicated human cell lines (PDA highlighted in blue). h. Immuno-fluorescence staining of MYOF-HA (green) and LAMP2 (red) in HEK293T (left) and KP4 (right) cells. Arrowheads indicate plasma membrane localization of MYOF in HEK293T cells and lysosome localization in KP4 cells. Scale, 20μm, inset scale, 2μm. i. Biotinylation of cell surface proteins in KP4 and HEK293T cells expressing MYOF-HA. Biotinylated proteins were immuno-precipitated and western-blotted for MYOF. Note, MYOF is not on the cell surface of KP4 cells while MYOF-HA is present on the cell surface when expressed in HEK293T cells. j. Affinity purified lysosomes were treated with increasing concentrations of Proteinase K as indicated. Intraluminal proteins are protected from degradation (LAMP2, Cathepsin C, LC3B) while extra-luminal proteins are sensitive to digestion (NPC1 and MYOF). Statistics source data are provided in Source data. Unmodified blots are provided in Source Data Figure 1. Experiments depicted in i, g, j are representative of two independent experiments.
