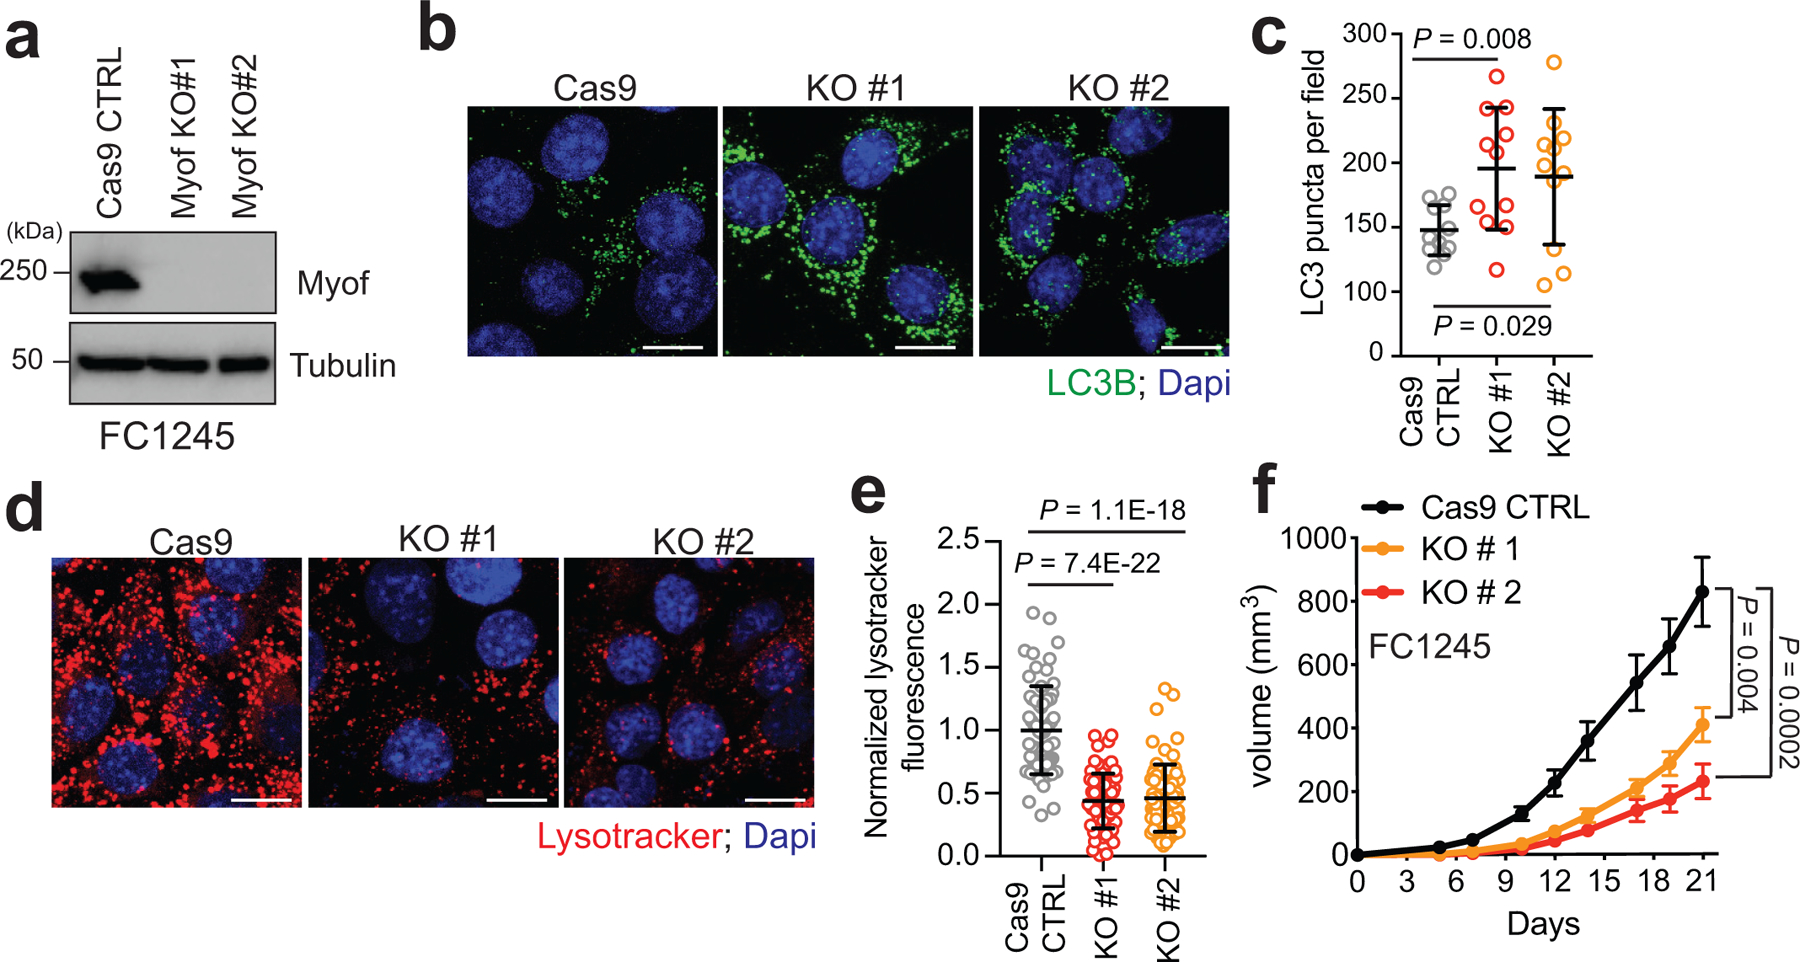
Extended Data Figure 7 |. MYOF is required for growth of mouse PDA tumors.

a. Immunoblot of the indicated proteins in mouse KPC cells (FC1245) following CRISPR mediated knockout of Myof. b,c. Immunofluorescence staining of LC3B positive autophagosomes in FC1245 Myof KO cells relative to Cas9 control cells. Graph shows quantification of LC3B puncta from n = 11 fields per condition. Data are mean ± s.d. d,e. Immunofluorescence images of Lysotracker red staining in FC1245 Myof KO cells compared to Cas9 control cells. Graph shows quantification from n = 70 (Cas9 control), 71 (KO#1), 70 (KO#2) cells per condition. Data are mean ± s.d. f. Growth rate of Cas9 control and Myof KO FC1245 allografts following s.c. transplantation in syngeneic C57BL/6 host mice. N=6 (Cas9 ctrl), 5 (KO#1), 5 (KO#2) animals per group. Scale, 20μm for all panels. Data represent mean ± s.e.m. P values determined by unpaired two-tailed t-tests.
