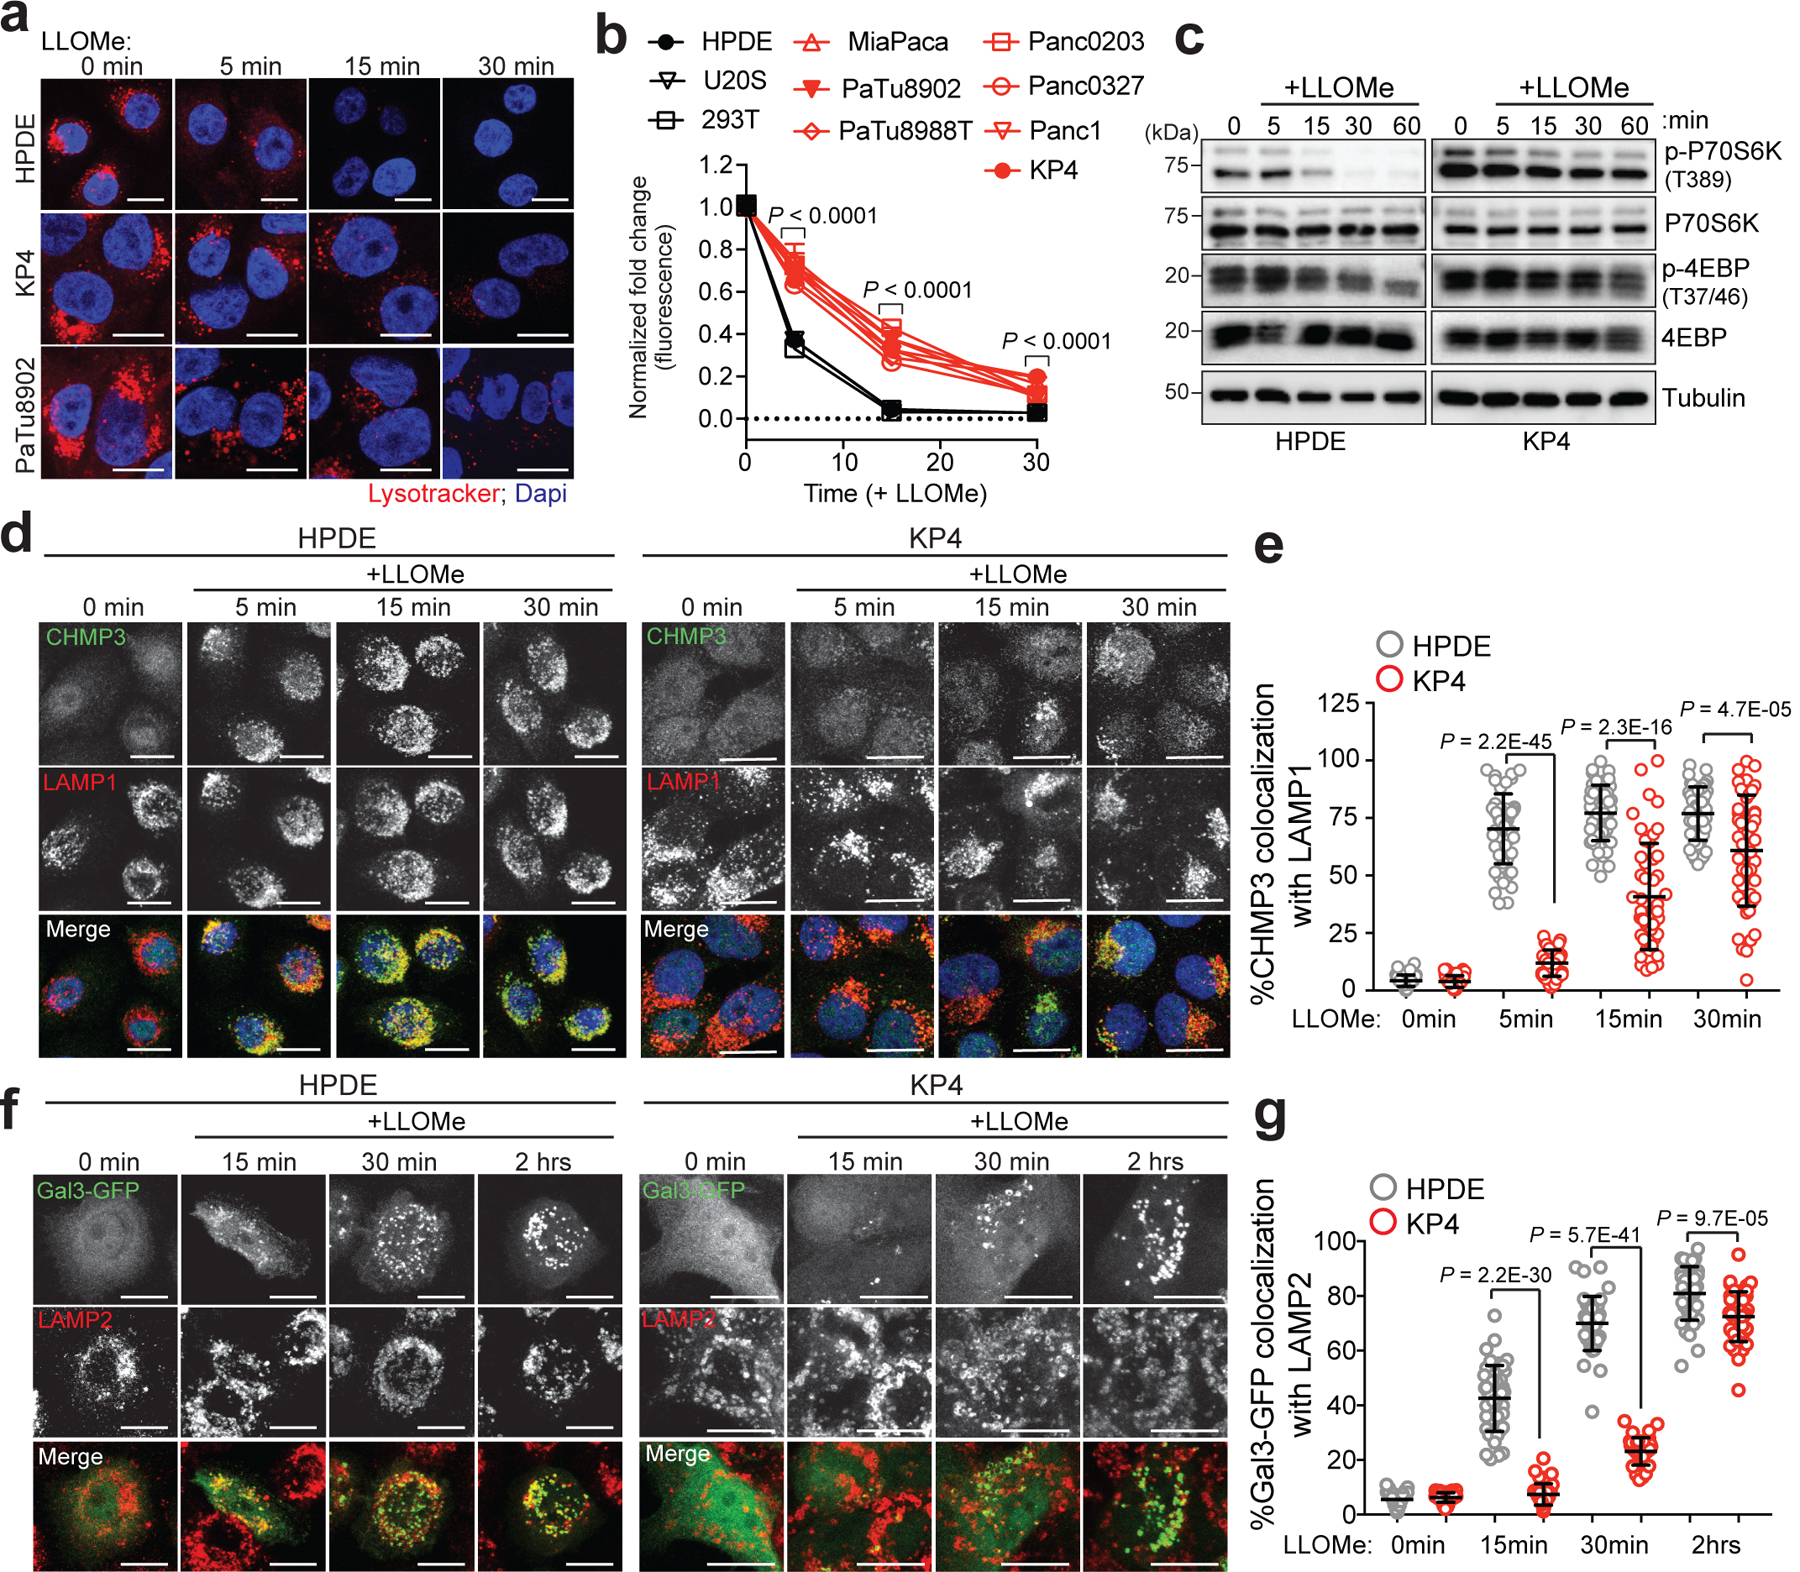
Fig. 2 |. PDA lysosomes are more resistant to lysosome membrane damage.

a. Time-course of lysotracker red staining in HPDE, KP4 and PaTu8902 following treatment with LLOMe. b. Quantification of normalized fold change in lysotracker red stain in the indicated cell lines treated with LLOMe. Data are mean ± s.e.m (HPDE n = 76, 80, 81, 80; KP4 n = 80, 77, 80, 82; PaTu8902 n = 96, 96, 81, 82 cells; HEK293T n= 81, 83, 83, 82; U2OS n= 64, 58, 64, 60 cells per time point; MiaPaCa; Panc0203; PaTu8988T; Panc0327, Panc1 n= 60 cells per time point). P values determined by two-way ANOVA. c. Immunoblots for the indicated proteins in HPDE and KP4 cells following time course treatment with LLOMe. d. HPDE and KP4 cells with and without LLOMe treatment were co-stained for CHMP3 (green) and LAMP1 (red). e. Quantification of percentage co-localization in control and LLOMe treated cells. (HPDE n = 50, 51, 50, 51; KP4 n = 51, 50, 50, 50 cells per time point). f. HPDE and KP4 cells expressing GFP-Galectin 3 (green) were treated with LLOMe for the indicated times and co-stained for LAMP2 (red). g. Quantification of percentage co-localization in control and LLOMe treated cells. (HPDE n = 39, 43, 40, 42; KP4 n = 43, 42, 40, 42 cells per time point). Scale, 20μm for all panels. Data are mean ± s.d. P values determined by unpaired two-tailed t-tests. Statistics source data are provided in Source data. Unmodified blots are provided in Source Data Figure 2. Experiments depicted in d, f are representative of two independent experiments.
