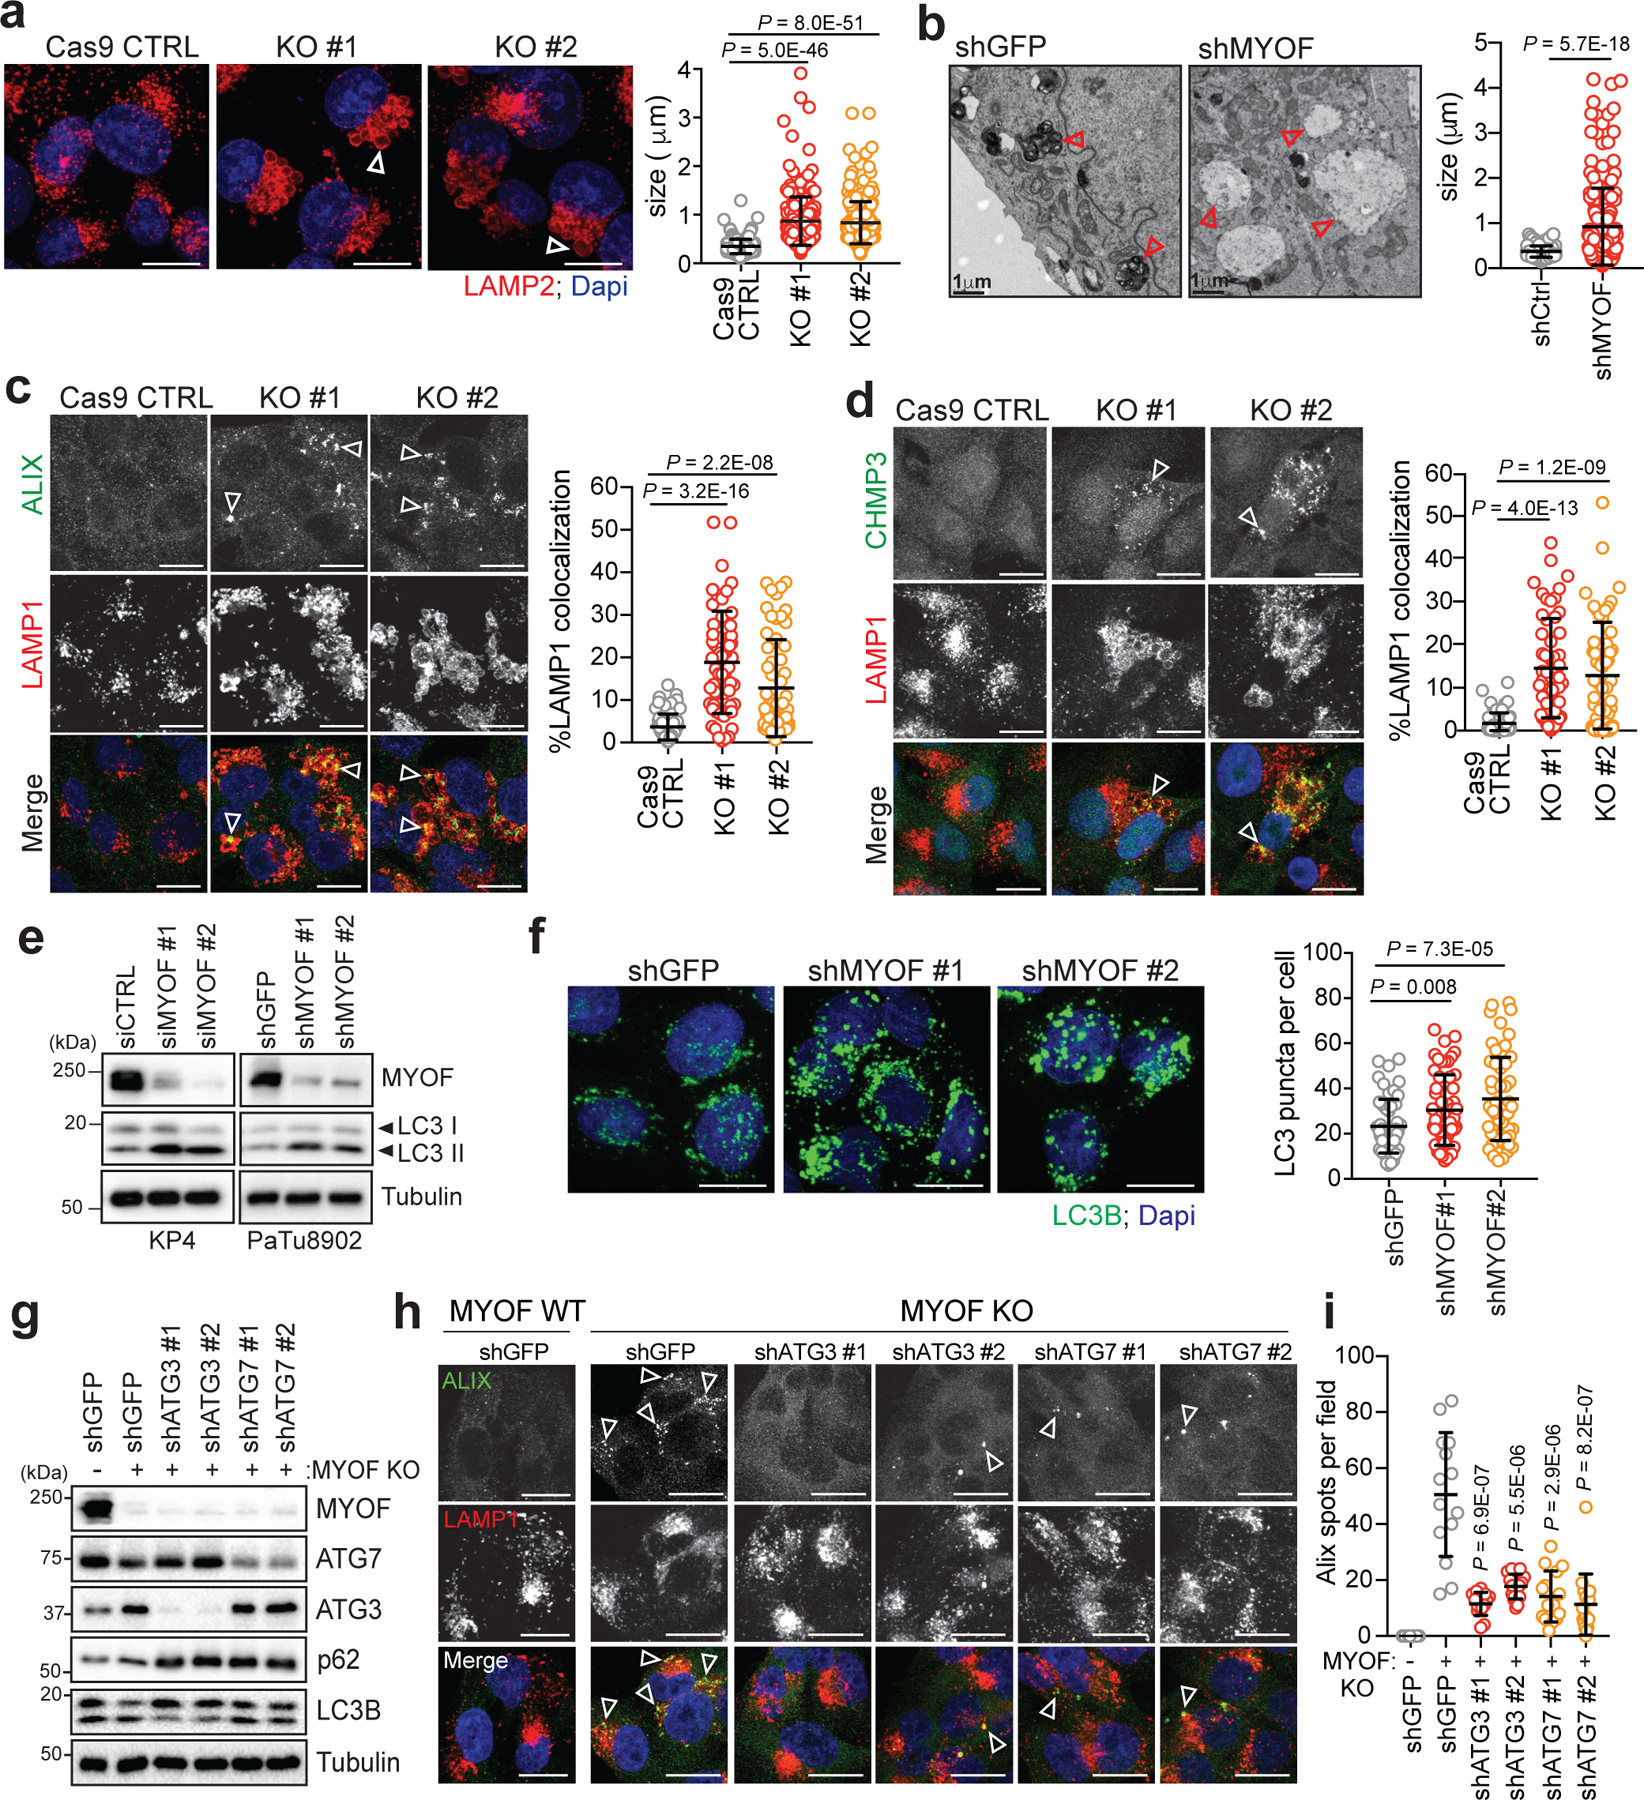
Fig. 3 |. MYOF is essential for lysosome function in PDA cells.

a. Immunofluorescence staining of LAMP2 (red) following CRISPR mediated knockout of MYOF and Cas9 control KP4 cells. Graph at right shows measurement of lysosome diameter from n = 252 (Cas9 control), 251 (KO#1, KO#2). b. Representative electron microscopy images showing aberrant lysosome morphology in KP4 cells following shRNA mediated knockdown of MYOF. Arrowheads highlight differential lysosome morphology in shGFP versus shMYOF conditions. Graph on the right shows quantification of lysosome diameter (n = 200 lysosomes from control; n = 202 lysosomes from MYOF KD cells). Scale bar 1μm. c, d. Increased recruitment of ALIX (green; arrowheads) (c) and CHMP3 (green; arrowheads) (d) to LAMP1 positive lysosomes (red) following KO of MYOF in KP4 cells relative to Cas9 control cells. Graphs show the quantification of percentage ALIX (n = 60 fields per condition) and CHMP3 (n = 57 fields per condition) co-localization with LAMP1. e. Immunoblot showing increased LC3B lipidation (arrowheads) in KP4 and 8902 cells upon siRNA or shRNA mediated knockdown of MYOF. f. Immunofluorescence staining for LC3B (green) showing increase accumulation of LC3B positive autophagosomes in KP4 cells following shRNA mediated knockdown of MYOF compared to control cells. Graph on the right shows quantification of LC3B puncta (n = 14 fields/condition). g. Immunoblot confirming shRNA mediated knockdown of ATG3 and ATG7 and autophagy blockade in KP4 MYOF KO cells. h. Recruitment of ALIX (green; arrowheads) to lysosomes (LAMP1; red) in KP4 cells in the presence (WT; n = 14) and absence (KO; n = 14) of MYOF. shRNA mediated knockdown of ATG3 (n = 14 (#1), 15 (#2) fields per condition) or ATG7 (n = 15 (#1), 16 (#2) fields per condition) to suppress autophagy causes a decrease in lysosome localization of ALIX in MYOF KO cells. i. Graph on the right shows quantification of ALIX puncta per condition. Scale, 20μm. Data are mean ± s.d. P values determined by unpaired two-tailed t-tests. Statistics source data are provided in Source data. Unmodified blots are provided in Source Data Figure 3. Experiment depicted in g are representative of two independent experiments.
