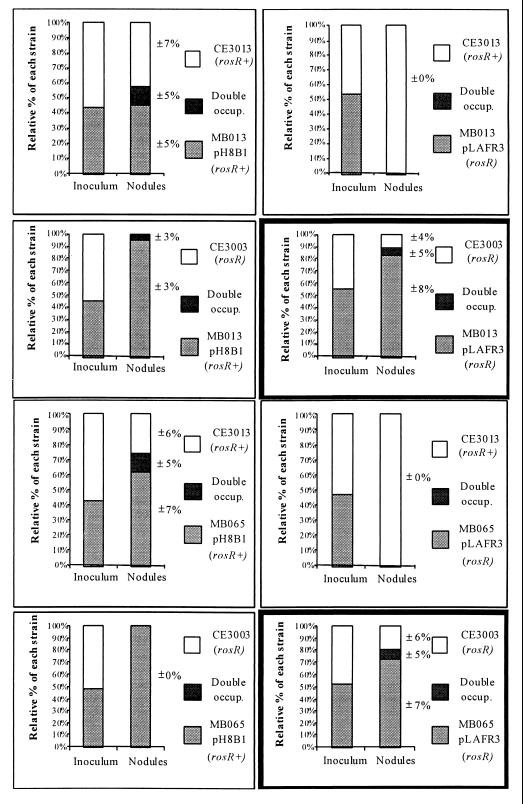
FIG. 3.
Nodulation competitiveness of mutants MB013 and MB065. Each graph represents a separate treatment. The relative percentage of each strain in the inoculum is indicated by the bar on the left, and the relative percentage of nodules later occupied by each strain (or of nodules occupied by both strains [double occup.]) is indicated by the bar on the right. The treatments that demonstrate the increase in competitiveness of MB013 and MB065 are highlighted by heavy outlining. Standard errors are indicated adjacent to each column division.

