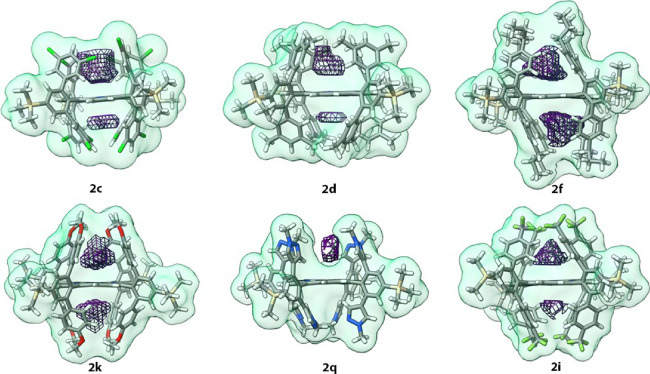
Figure 3.
Pockets of 2c, 2d, 2f, 2k, 2q, and 2i as calculated with POVME2 using atomic coordinates from single-crystal X-ray diffraction data. The molecules are shown as sticks with a green surface at the van der Waals distance. The pockets are depicted as purple mesh. Atomic color code: C gray, H white, O red, N blue, Si tan, Cl green, and F light green. Molecular graphics and analyses performed with UCSF ChimeraX.28

