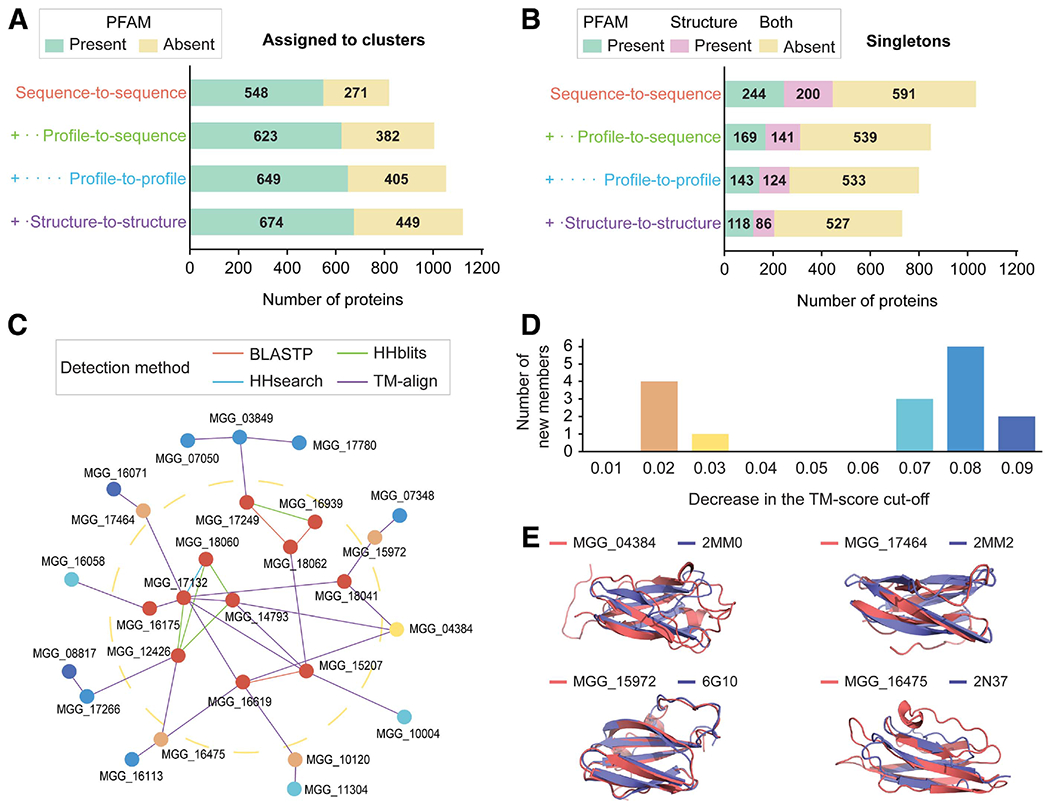
Fig. 4.

Statistics on secretome clustering and the MAX effector cluster. Four methods were sequentially used to reveal sequence-based and structure-based similarity. In all cases of the sequence-based methods, only the pairs with E-value < 10−4 and bidirectional coverage >50% were regarded as significant. A, The number of proteins found in clusters with at least another homolog or structural analog in the Magnaporthe oryzae secretome. B, The number of singletons without any homologs or analogs in the M. oryzae secretome. The number of proteins with meaningful PFAM domains, excluding domains of unknown functions, or structures predicted with estimated precision ≥ 0.6 are indicated. C and D, The network graph for MAX effectors and the number of newly retrieved singletons. C, Each node and edge represent a protein and similarity that can be detected by the method. The MAX effector cluster with 11 members (cluster 26) exists inside the yellow dotted ring. The newly retrieved singletons remain outside the ring. D, Criteria for the final model selection and the significant structural similarity were relaxed by the template modeling (TM) score of 0.01. The number of newly retrieved singleton members is indicated. Colors correspond in C and D. E, Structural superposition of the newly retrieved MAX effector members and their most similar structures available in the Protein Data Bank. The normalized TM scores, as a measure of similarity, were 0.47 and 0.63 for MGG_04384 and 2MM0 (ToxB), 0.47 and 0.46 for MGG_17464 and 2MM2 (ToxB), 0.81 and 0.89 for MGG_15972 and 6G10 (Avr-PikD), and 0.47 and 0.60 for MGG_16475 and 2N37 (Avr-Pia).
