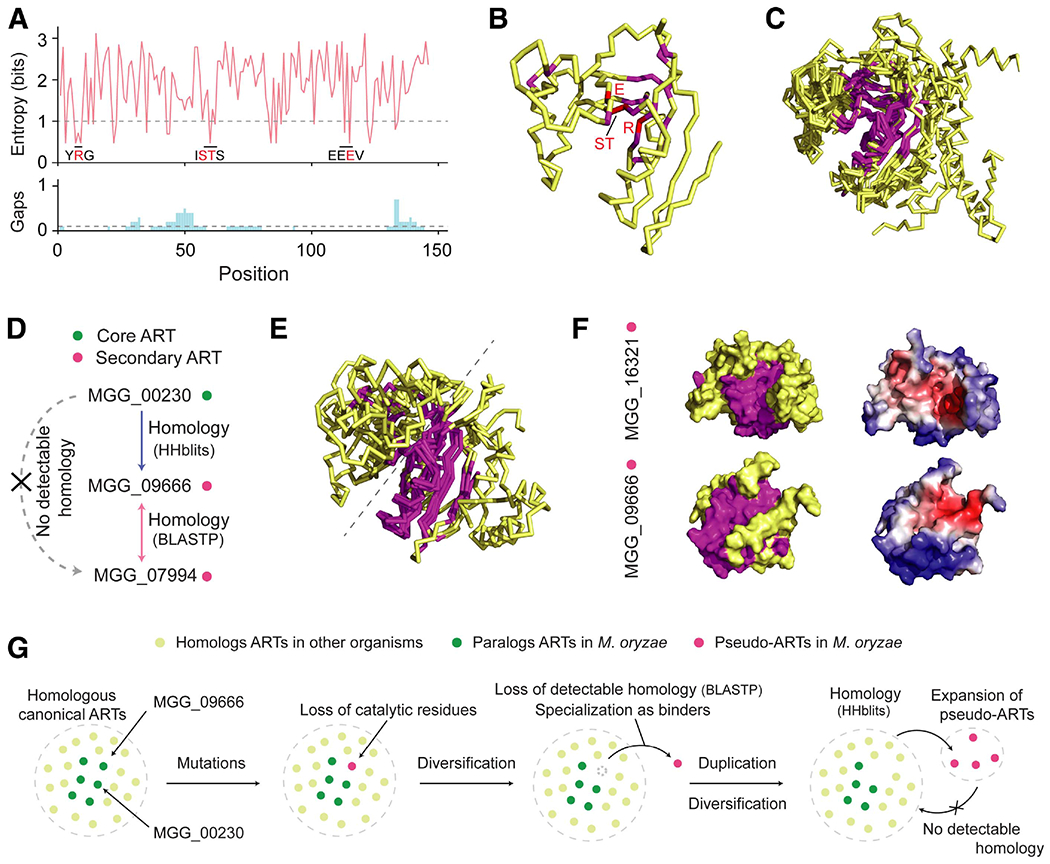
Fig. 6.

Evolution of putative ADP-ribose transferases (ARTs) informed through structural comparison. A, Entropy plot for the core putative ARTs with structures predicted with estimated precision > 0.75 and the ADP-ribosylation fold. The 10 sequences were aligned with MAFFT, and Shannon’s entropy was calculated for the columns that contain MGG_00230 sequences. The gap was ignored in the entropy calculation but the proportion of gap characters is indicated below the entropy plot. The cut-off for conserved residues was entropy < 1 and the proportion of gap < 0.1. Known catalytic residues (red) and residues around them (black) are indicated in the entropy plot. B, Ribbon structure of MGG_00230 with annotated conserved and catalytic residues in magnate and red, respectively. C, Structural superposition of the 10 core ARTs and Scabin toxin generated with multiple template modeling (mTM)-align (Dong et al. 2015). The structural core measured with the maximum pairwise residue distance < 4Å is indicated in magnate. D, Homology relationship between the core and secondary ARTs in cluster 8. The arrow indicates the direction of homology detection. For instance, MGG_00230 → MGG_09666 denotes that homology to MGG_09666 is detectable when MGG_00230 is used as a query. HHblits was used as a more sensitive sequence similarity method. E, Structural superposition of the four secondary ARTs and a core ART, MGG_00230, generated with mTM-align. The structural core is in magnate. F, Surface structures of secondary ARTs MGG_16321 and MGG_09666. The left models indicate the conserved structural core in magnate. The right models display interaction interfaces in red predicted by MaSIF. G, A proposed mechanism of the ART evolution in Magnaporthe oryzae.
