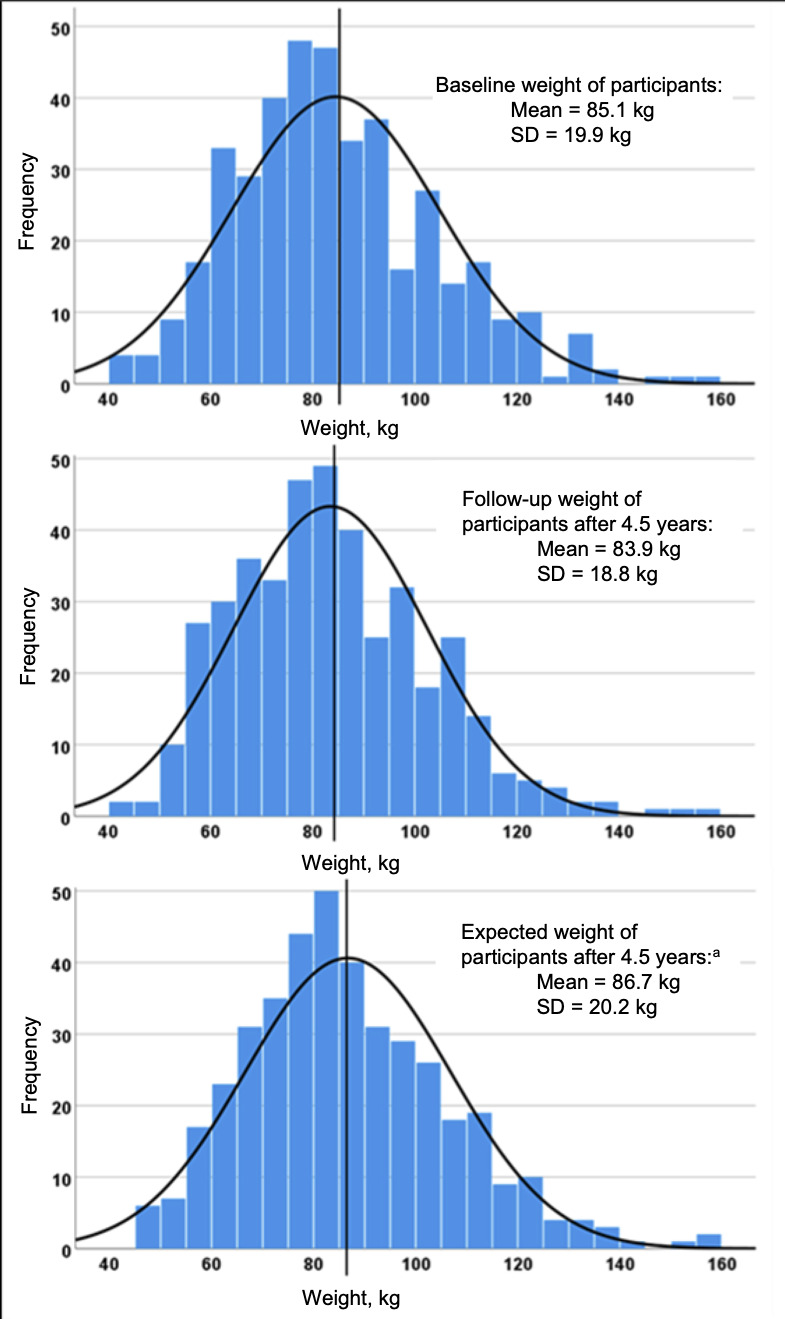
Figure 2. Comparison of the distribution of participants’ weight at baseline, follow-up and ‘expected’ follow-up weight (calculated from the weight gain per annum observed in recent [2020] Public Health England data). 20 .

aThe period between baseline and follow-up was 4.5 years. To calculate the expected weight of participants at follow-up, the authors added 0.5kg1 x 4.5 years to the baseline weight of participants who were ≥40 years old at baseline. For participants who turned 40 during the follow-up period, 0.5kg per year was added pro rata.
