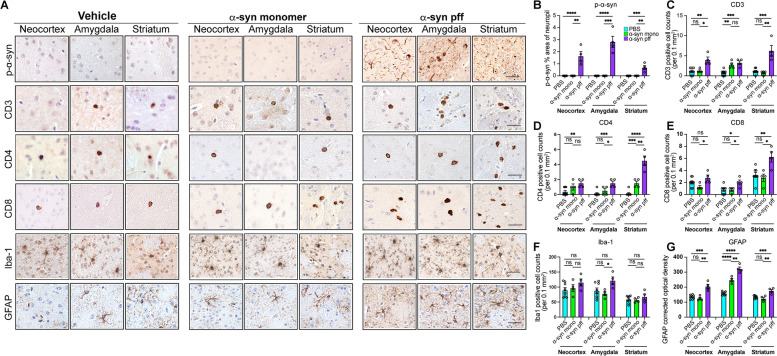
Fig. 4.
Comparison of the immune response effects of monomeric vs ɑ-syn pff in young mice. A Representative images for p- ɑ-syn, CD3, CD4, CD8, Iba-1 and GFAP immunostaining of young mouse cohort at 1-month post injection. Images are from three brain regions (M1/M2 or somatosensory cortex (Neocortex), basolateral and basomedial amygdala (Amygdala), and dorsal striatum (Striatum)). Left panels are PBS (vehicle) injected, the panels in the middle are from mice injected with the ɑ-syn monomer and to the right are ɑ-syn pff injected. B Image analysis of p-ɑ-syn % area of neuropil. C Image analysis of CD3 positive cell counts per 0.1 mm2. D Image analysis of CD4 positive cell counts per 0.1 mm2. E Image analysis of CD8 positive cell counts per 0.1 mm2. F Image analysis of Iba-1 positive cell counts per 0.1 mm2. G Image analysis of GFAP optical density. Data are mean ± SEM. One-way ANOVA with Tukey’s post hoc test was used. *p < 0.05; **p < 0.01; ***p < 0.001; ****p < 0.0001. Scale bar, 40 μm

