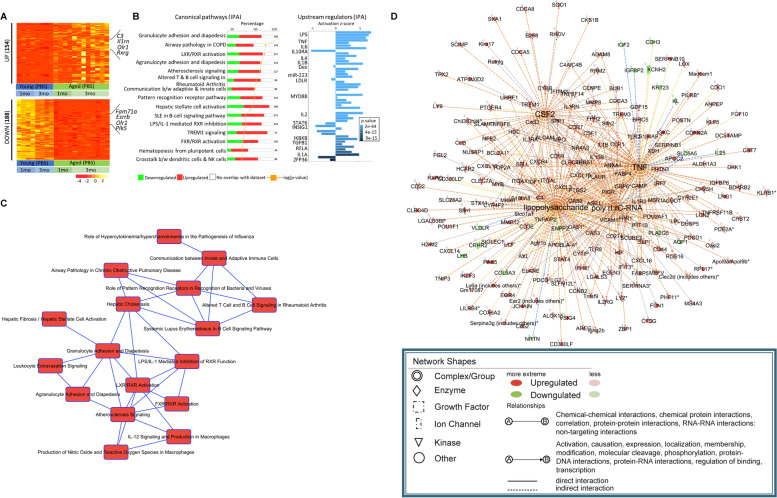
Fig. 7.
Characterization of age-associated genes in microglia. A RNA from microglia of PBS injected young and aged mice were compared to identify the age-associated differentially expressed genes (DEGs). The RNA-Seq identified 622 up- and 188 downregulated genes (≥ twofold change, p < 0.05) (for visual purpose, 154 ≥ fourfold upregulated genes have been shown). For the age-associated comparison, PBS injected control mice from 1- and 3-months (including repeats) post injection groups were combined and the TpM normalized values of the DEGs are represented in the heatmap. The number of DEGs are mentioned on the left of the heatmap with few of the prominent genes mentioned on the right. B The age-associated differentially expressed genes (both up- and downregulated) were analyzed with IPA to identify enriched canonical pathways (left), and upstream regulators of the genes (right). The canonical pathways show the most enriched biological processes along with the percentage of up-(red) and downregulated (green) genes in each pathway with total number of genes mentioned outside the bar graphs. The -log p-value from the enrichment analysis is represented by a yellow dot. The upstream regulator plot identifies the cascade of upstream transcriptional regulators whose expression is affected by aging. Prominent immune regulators are noted. The bar graph shows the activation Z-score where a positive score implies activation of the transcriptional regulator while the negative score indicates repression. The color of the bar graph represents the p-value. C Based on the canonical pathways derived from IPA, a network was constructed comprising of pathways with more than 5 common enriched genes (or other molecules) that changed with age. D Based on the transcriptional upstream regulators obtained from IPA, a network of the top upstream regulators (CSF2, LPS, TNF and poly rl:rC-RNA) and their target genes (or other molecules) was constructed. This plot shows how the upstream regulator networks overlap via their target genes

