Fig. 2.
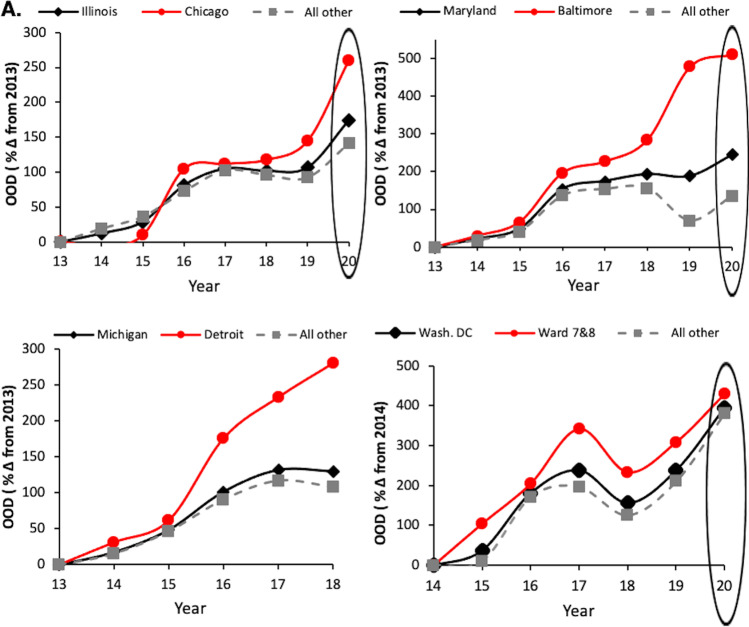
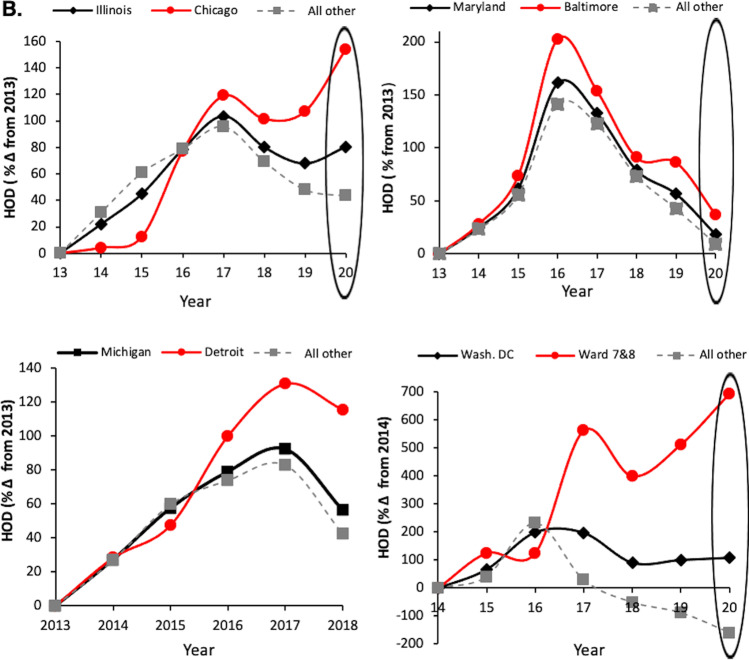
Opioid overdose deaths (all opioids) and heroin overdose deaths in Illinois, Maryland, Michigan and Washington DC—Comparison of Urban Capitals and Rural. A All deaths due to any opioids were analyzed for Chicago, Illinois, and non-Chicago regions (top left); Baltimore, Maryland, and non-Baltimore city regions of MD (top right); Detroit, Michigan, and non-Detroit regions of MI (bottom left); Wards 7 and 8, all of Washington DC, and non-Wards 7 and 8 parts of DC (bottom right). Note that Ward 5 is also considered a hotspot for OODs but not calculated with wards 7 and 8, thus may reduce the extent of disparities for Washington DC’s Black neighborhoods. B Deaths where heroin was implicated (heroin overdose deaths (HOD). Red circles (cities or Wards 7 and 8); black diamonds (overall state or Washington DC data); gray squares (overall state—city = ‘all other’ regions of that state). Data expressed as percent change over 2013, or 2014 for DC. The large oval highlights data influenced by the COVID-19 pandemic in 2020


