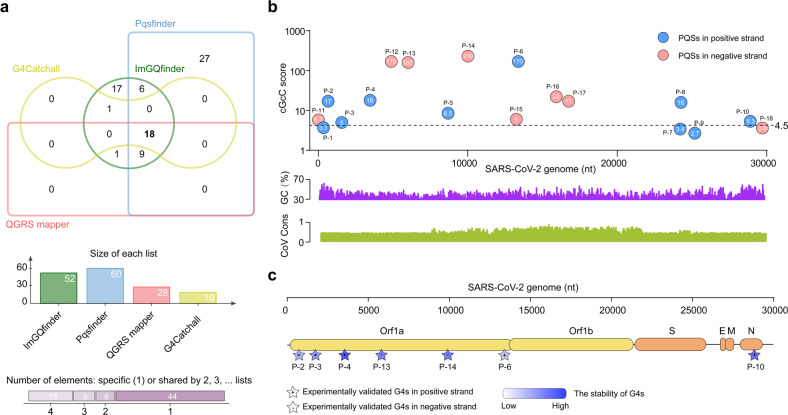
Fig. 1. Detection and annotation of G-quadruplexes (G4s) in SARS-CoV-2 genome.
a Top, edwards’ Venn diagram showing the overlap of the putative G4-forming sequences (PQSs) predicted by four independent softwares (G4catchall, QGRS mapper, Pqsfinder and ImGQfinder) in the genome of SARS-CoV-2. Bottom, charts showing the list size and intersection size repartition. b The location and score of the SARS-CoV-2 PQSs. Top, the cGcC score and location of SARS-CoV-2 PQSs. The cG/cC score of PQSs is calculated by using G4RNA screener. Bottom, the GC percent track and multiple alignments of 7 human coronavirus sequences. cGcC, consecutive G over consecutive C ratio. c The location and stability of experimentally validated G4s in the genome of SARS-CoV-2. The stability of G4s is detected by thermal melting assays.

