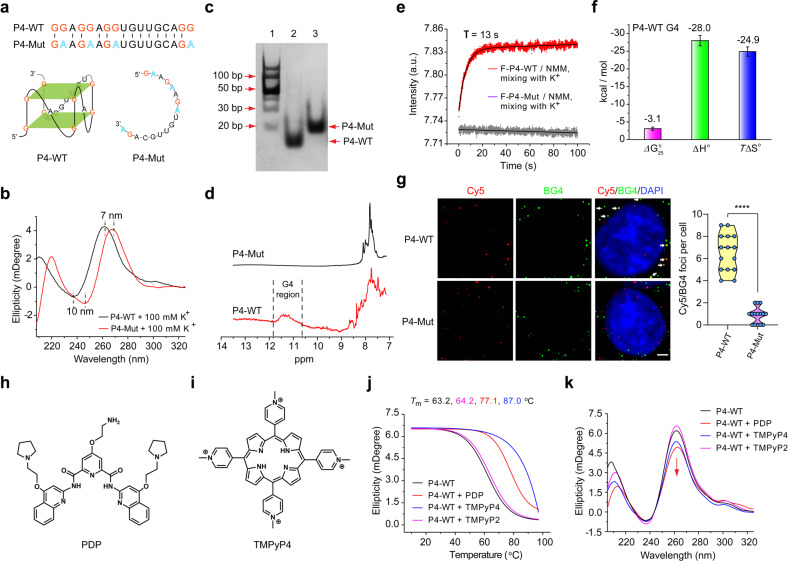
Fig. 2. Characterization of P4 G4 formation.
a Top, the sequences of P4 wild-type (P4-WT) and P4 mutant (P4-Mut). Bottom, the schematic representation of the proposed P4-WT and P4-Mut structures. b CD spectroscopy of P4-WT and P4-Mut. CD, circular dichroism. c The formation of P4 G4 detected by nondenaturing polyacrylamide gel electrophoresis experiments. Lane 1, DNA ladder; Lane 2, P4-WT; Lane 3, P4-Mut. d The formation of P4 G4 detected by 1H NMR. NMR, nuclear magnetic resonance. e The kinetic folding process of P4 G4 detected by the stopped-flow assays. f The thermodynamic parameters of P4 G4 formation estimated from the melting measurements. g The formation of P4 G4 in live cells detected by immunofluorescence assays. Left, the white arrows indicated the colocalized foci of Cy5-labeled RNA (red) with BG4 (green). Scale bars, 4 μm. Right, Cy5/BG4 foci number was quantified. ****P < 0.0001. h, i Chemical structures of PDP (h) and TMPyP4 (i). j CD thermal melting curves of P4-WT (1.5 μM) with PDP (1.5 μM), TMPyP4 (1.5 μM) or TMPyP2 (1.5 μM). k CD spectroscopy of P4-WT (1.0 μM) without or with PDP (1.0 μM), TMPyP4 (1.0 μM) or TMPyP2 (1.0 μM).

