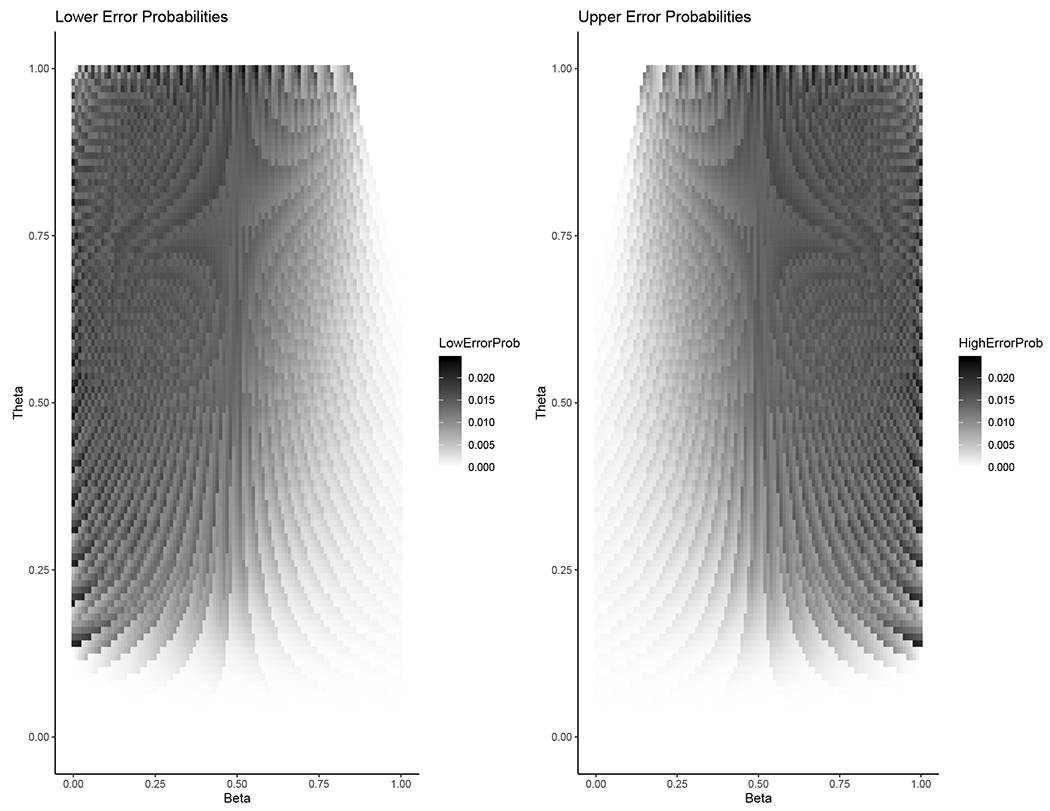
FIGURE 2.

Lower and upper errors from the 95% central melded confidence interval for Δ (equation 10) when n = 26 for all values of β, θ ∈ {0, 0.01, 0.02, …, 1}. The maximum of all the calculated errors for both the lower and upper errors was 0.0242, less than the nominal 0.025.
