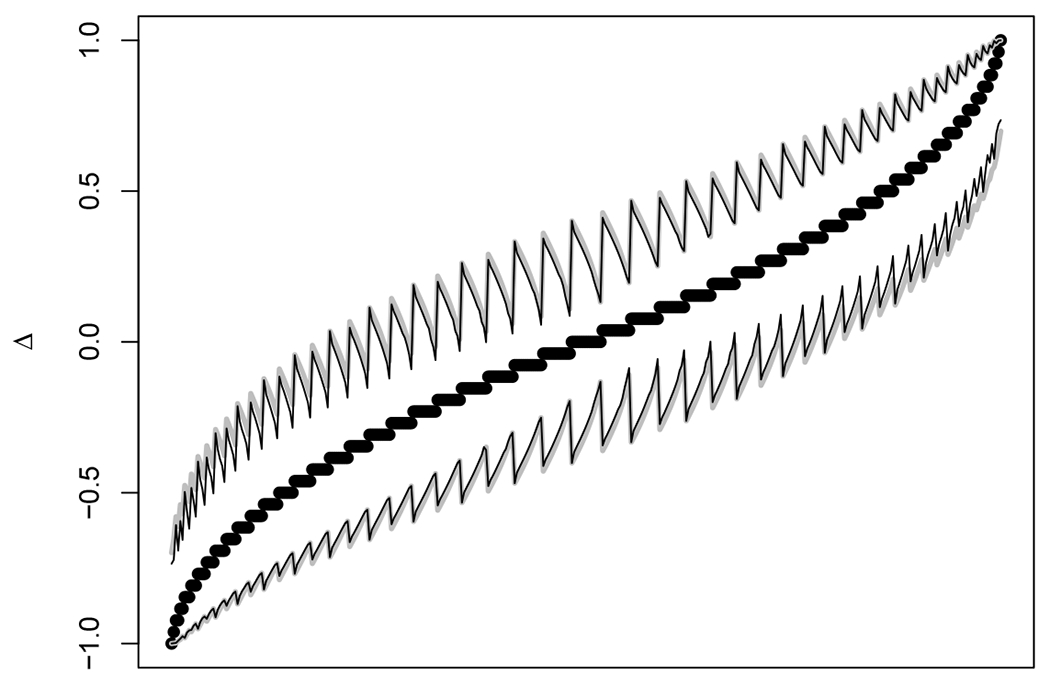
FIGURE 3.

For the case n = 26, we plot and the two confidence intervals for all possible 378 outcomes, sorted by , then within tied values of , sorted by LΔ(0.975). The thick gray lines define the 95% confidence intervals by the proposed melded method, and the thin black lines define the 95% confidence intervals by the Wang method. The x-axis only represents the rank of each of the 378 estimates, so it is not labeled.
