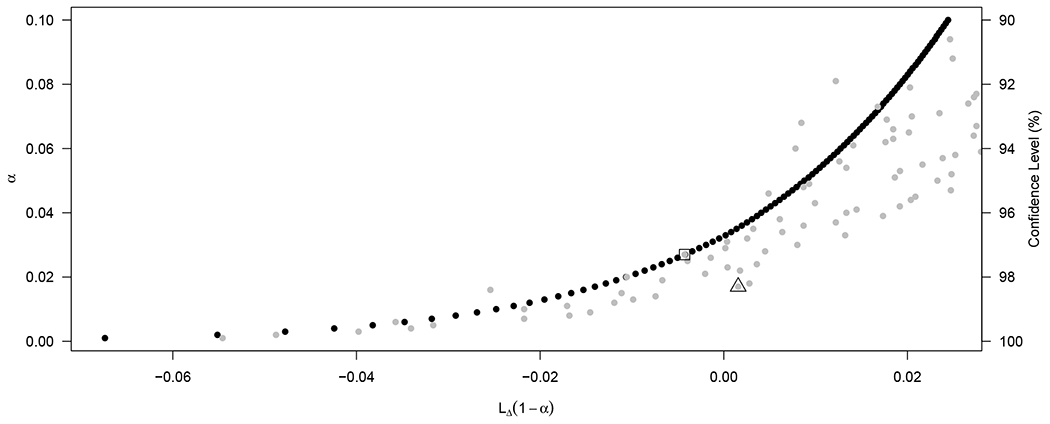
FIGURE 4.

Lower 100(1 − α)% confidence limits by α ∈ {0.001, 0.002, …, 0.100} for the data x = 9, m = 11 and n = 67. Black dots are the lower limit for the melding interval, LΔ(1 − α), and gray dots are the lower limit for the Wang interval, (1 − α). The point outlined by a square is Wang’s one-sided 97.3% limit, (0.973; 9, 11, 67) = −0.0043, and the point outlined by a triangle is the one-sided 98.3% limit, (0.983; 9, 11, 67) = 0.0016.
