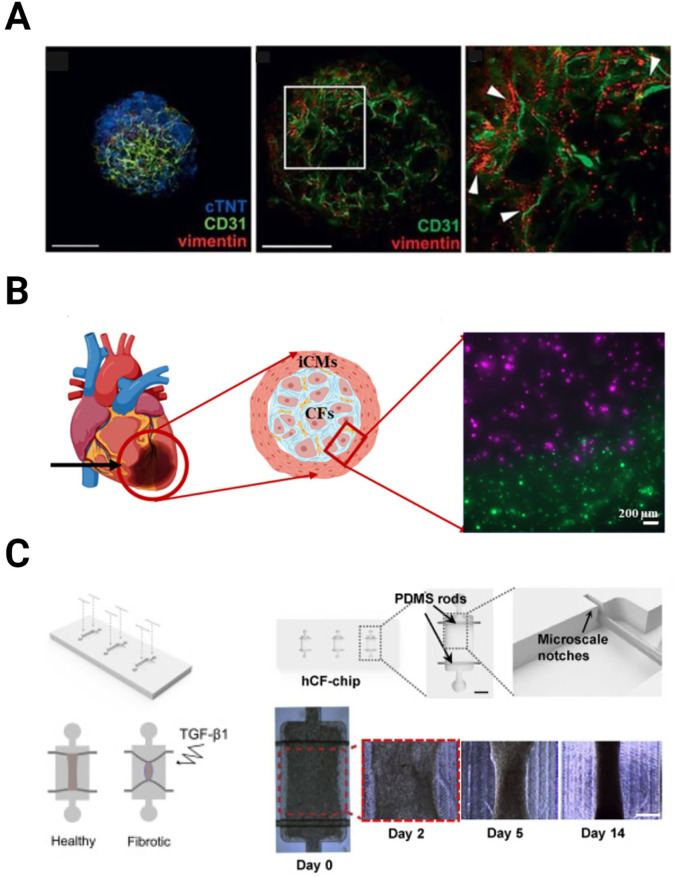
FIG. 3.
Different methods used to create the fibrosis models. (a) Organoids. Laser scanning confocal microscopy collapsed Z-stack of vascularized cardiac spheroids stained with antibodies against markers of cardiac fibroblasts (CFs), endothelial cells (ECs), and cardiomyocytes (CMs) (vimentin, CD31, and cTNT, respectively) (left). A single laser scanning confocal microscopy image showing vimentin-positive CFs are positioned immediately next to CD31-positive ECs (middle and right). Reproduced with permission from Figtree et al., Cells Tissues Organs 204, 191 (2017). Copyright 2017 Karger Publishers. (b) 3D bioprinting. Schematic showing the infarct region model and corresponding cell types. Inset picture showing the successful infarct region printing using stained iCMs (green) and hCFs (magenta) [Reproduced from Basara et al., Gels 7, 70 (2021). Copyright 2021, MDPI], (c) microfluidic devices. A schematic showing the healthy and TGF-β treated fibrotic tissue-on-chip (left). Display of the hCF-chip containing three microwells (top-middle). Top view image showing a well with two elastomeric rods (arrows) suspended on each end (inset-top-middle). (Scale bar: 1 mm). Schematic of the microscale notches on each end of the well, help hold the elastomeric rod in place (top-right). Representative images for control tissues at days 0, 2, 5, and 14 post-seeding (bottom right). (Scale bar: 500 μm) [Reproduced with permission from Mastikhina et al., Biomaterials 233, 119741 (2020). Copyright 2020 Elsevier].

