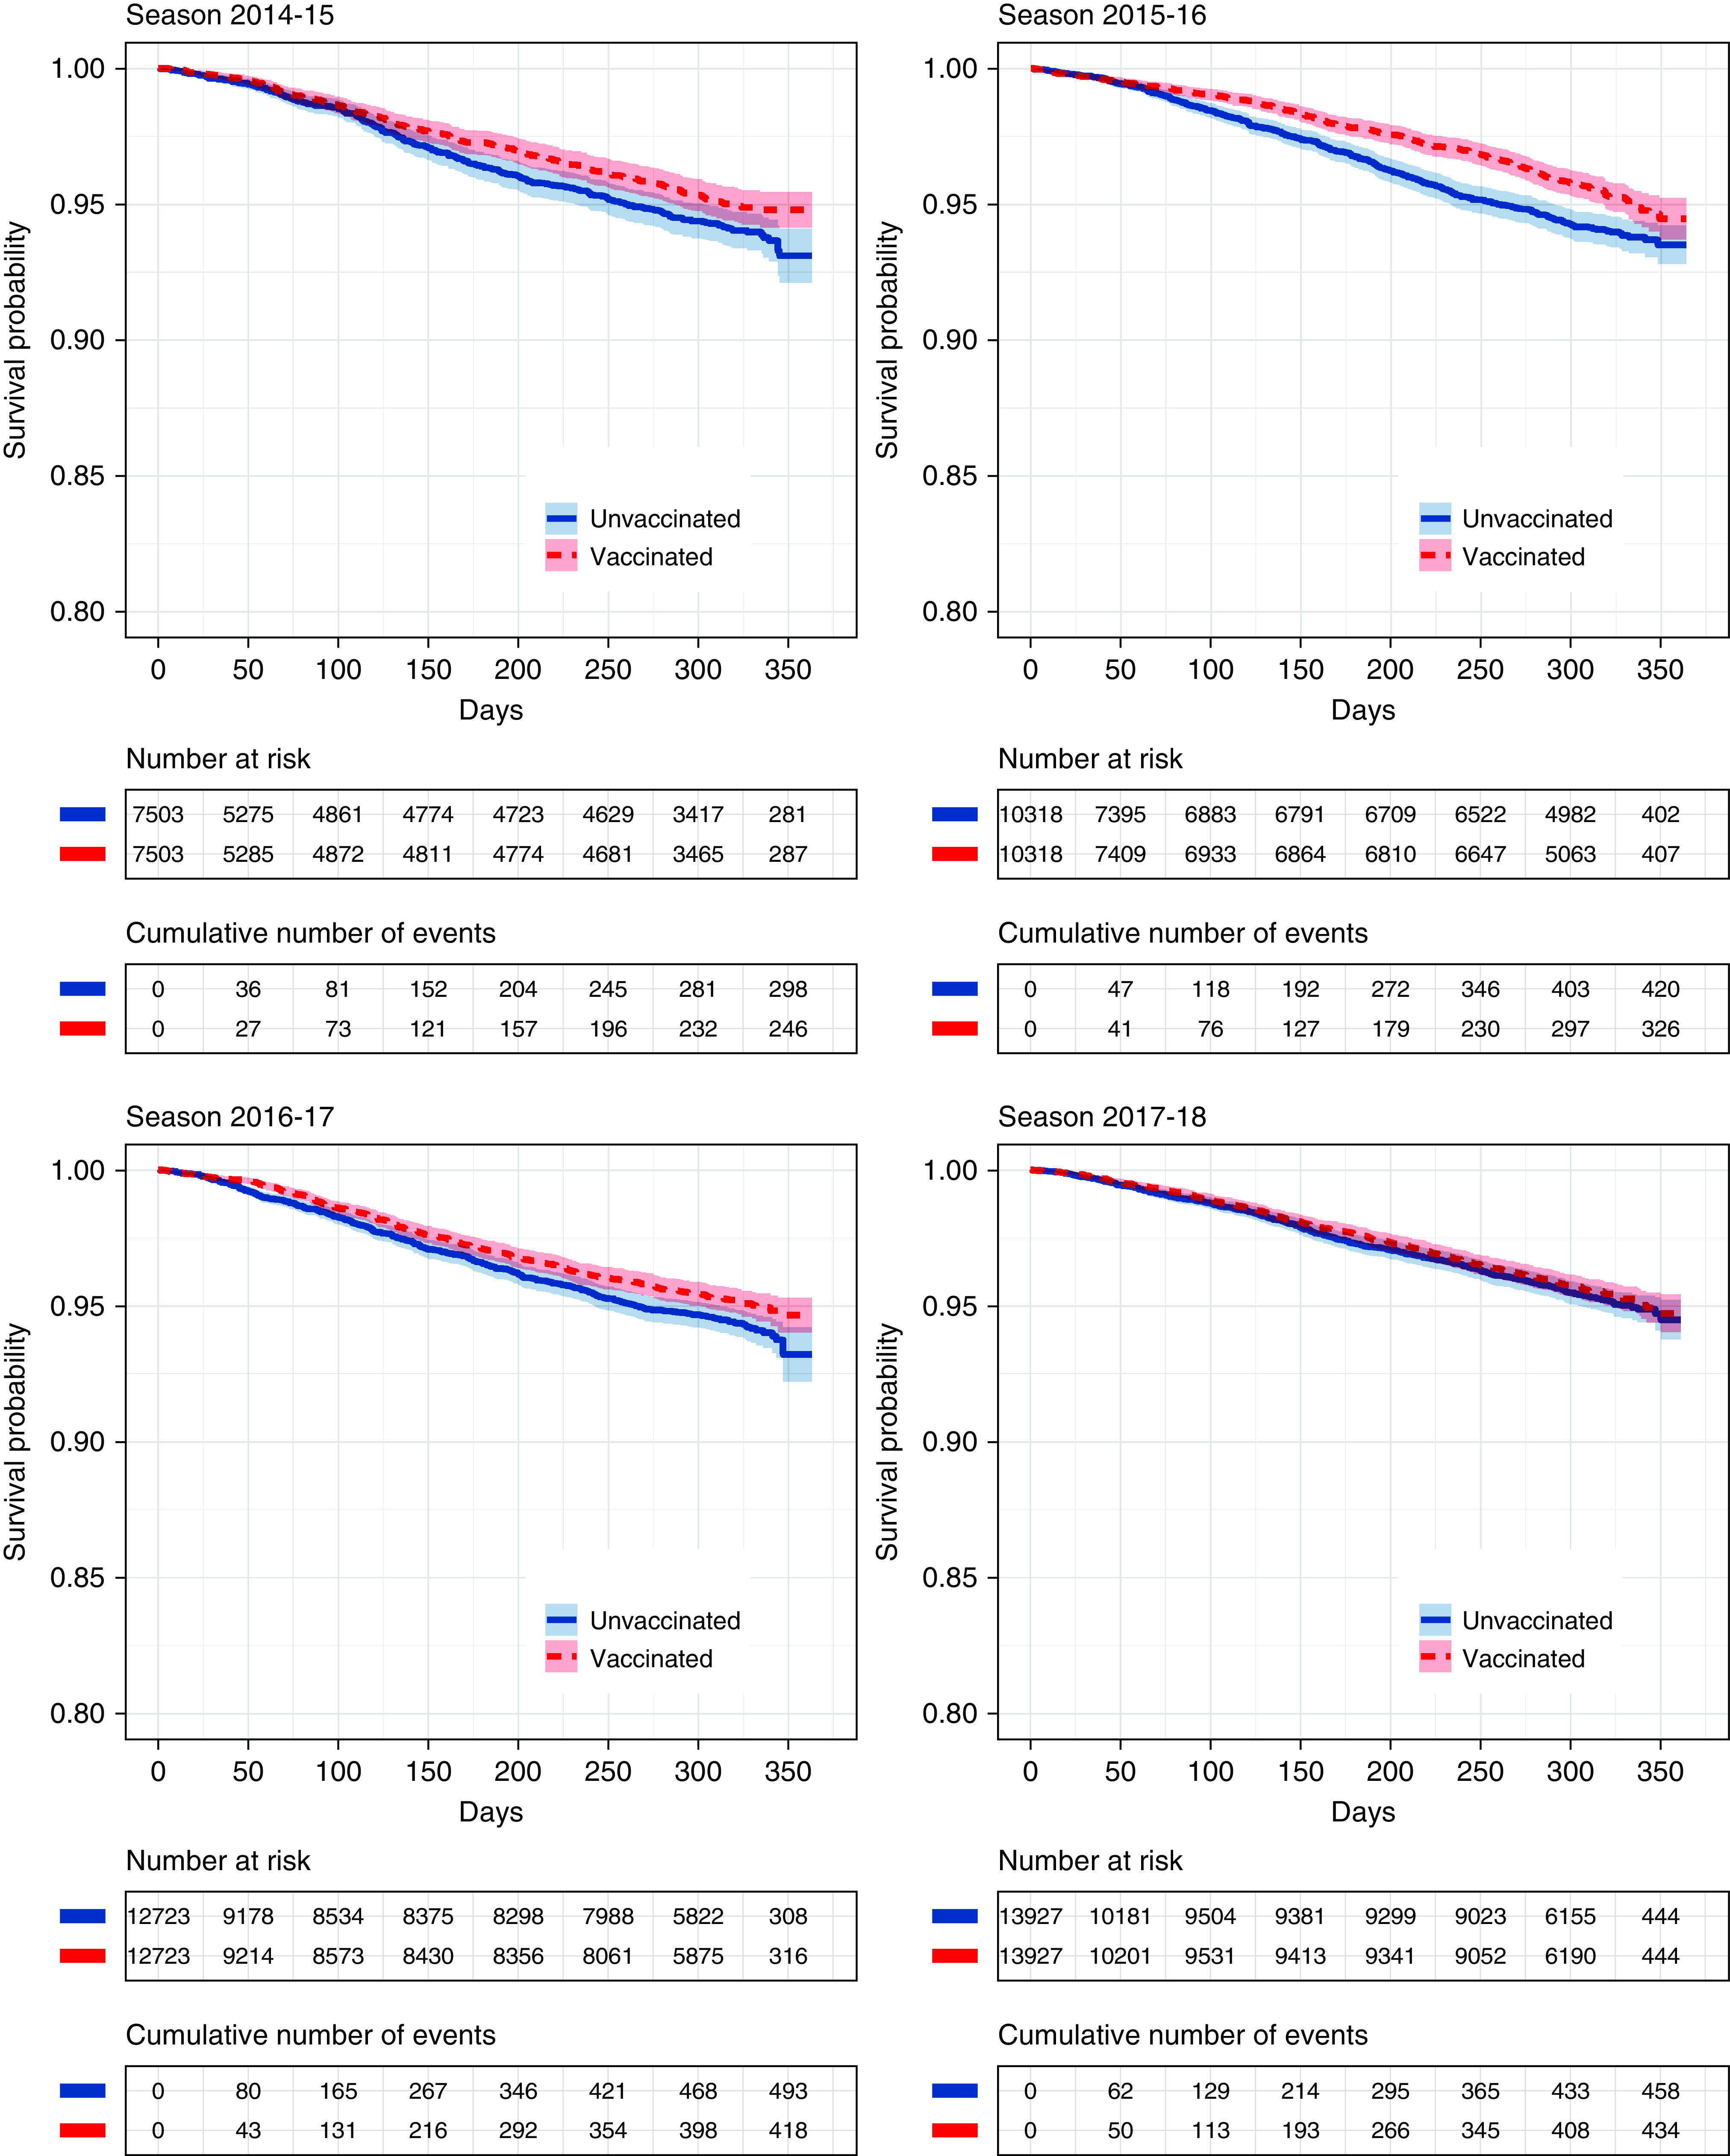
Figure 2.

Kaplan-Meier curves for mortality comparison with 95% confidence intervals. Curves depict the whole period from matching until the end of follow-up (maximum August 31). Colored areas represent 95% confidence intervals.

Kaplan-Meier curves for mortality comparison with 95% confidence intervals. Curves depict the whole period from matching until the end of follow-up (maximum August 31). Colored areas represent 95% confidence intervals.