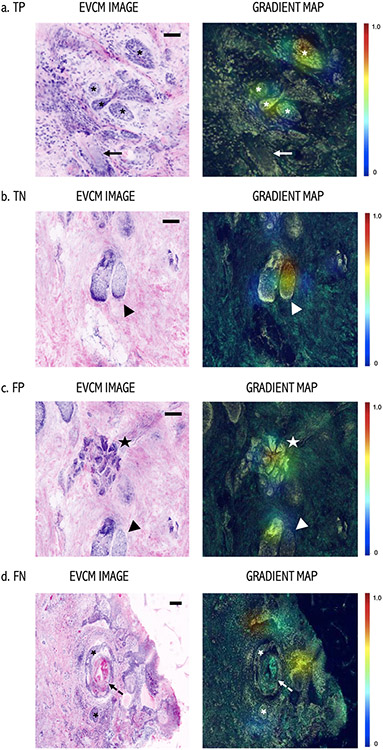
Figure 2. Gradient Map: Left: EVCM images and Right: Gradient maps.
(a) True positive (TP) example of a BCC with small tumor nodules (asterisks). High prediction attributes over the tumor nodules in the Gradient map. Note, that a hair follicle (arrow) in the same field was not considered “important” for the prediction by the algorithm. (b) True negative example of an area with no-BCC, where a sebaceous gland (arrowhead) was identified “important” region for negative prediction. (c) False positive (FP) example where eccrine glands (star) and sebaceous gland (arrowhead) were detected as important for the prediction of tumor. (d) False Negative (FN) example, where BCC tumor nodules (asterisks) were not considered important by the algorithm for tumor detection. Note, this BCC tumor nodule has an extensive cystic degeneration in the center (dashed arrow), which could have resulted in the false prediction in this case. Color scalebar: Red color, high attribution and blue color low attribution for a given prediction by the algorithm. Scale bars: a, b, c, d) 200 μm.

