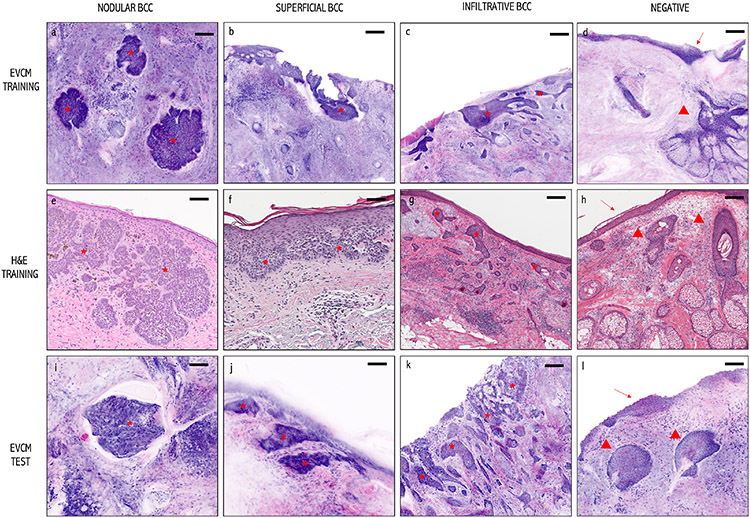
Figure 3. Images used to create training and test datasets:
EVCM images (upper and lower panel: Training and Test datasets): Purple and pink digitally colored EVCM images of: (a, i) nodular BCCs, (b, j) superficial BCC, (c, k) infiltrative BCC, and (d, l) normal (“not-BCC”) skin tissue with epidermis (arrow) and pilosebaceous gland (arrowhead). Conventional H&E-stained images (middle panel) of a: (e) a nodular BCC, (f) a superficial BCC, (g) an infiltrative BCC, and (h) normal (“not-BCC”) skin tissue with epidermis (arrow) and hair follicles (arrowheads). BCCs are shown with an asterisk. Scale bars: a, b, c, e, i, j) 100 μm and d, f, g, h, k) 200 μm.

